Solar Park Inspection Approach
From preparation to delivery — 23 hectares of solar panels, one day, 400 km away.

For privacy reasons regarding clients and locations, not all project details can be shared. Images and data on this page are sometimes sourced from a different reference project.
What a 23-hectare solar panel inspection really involves
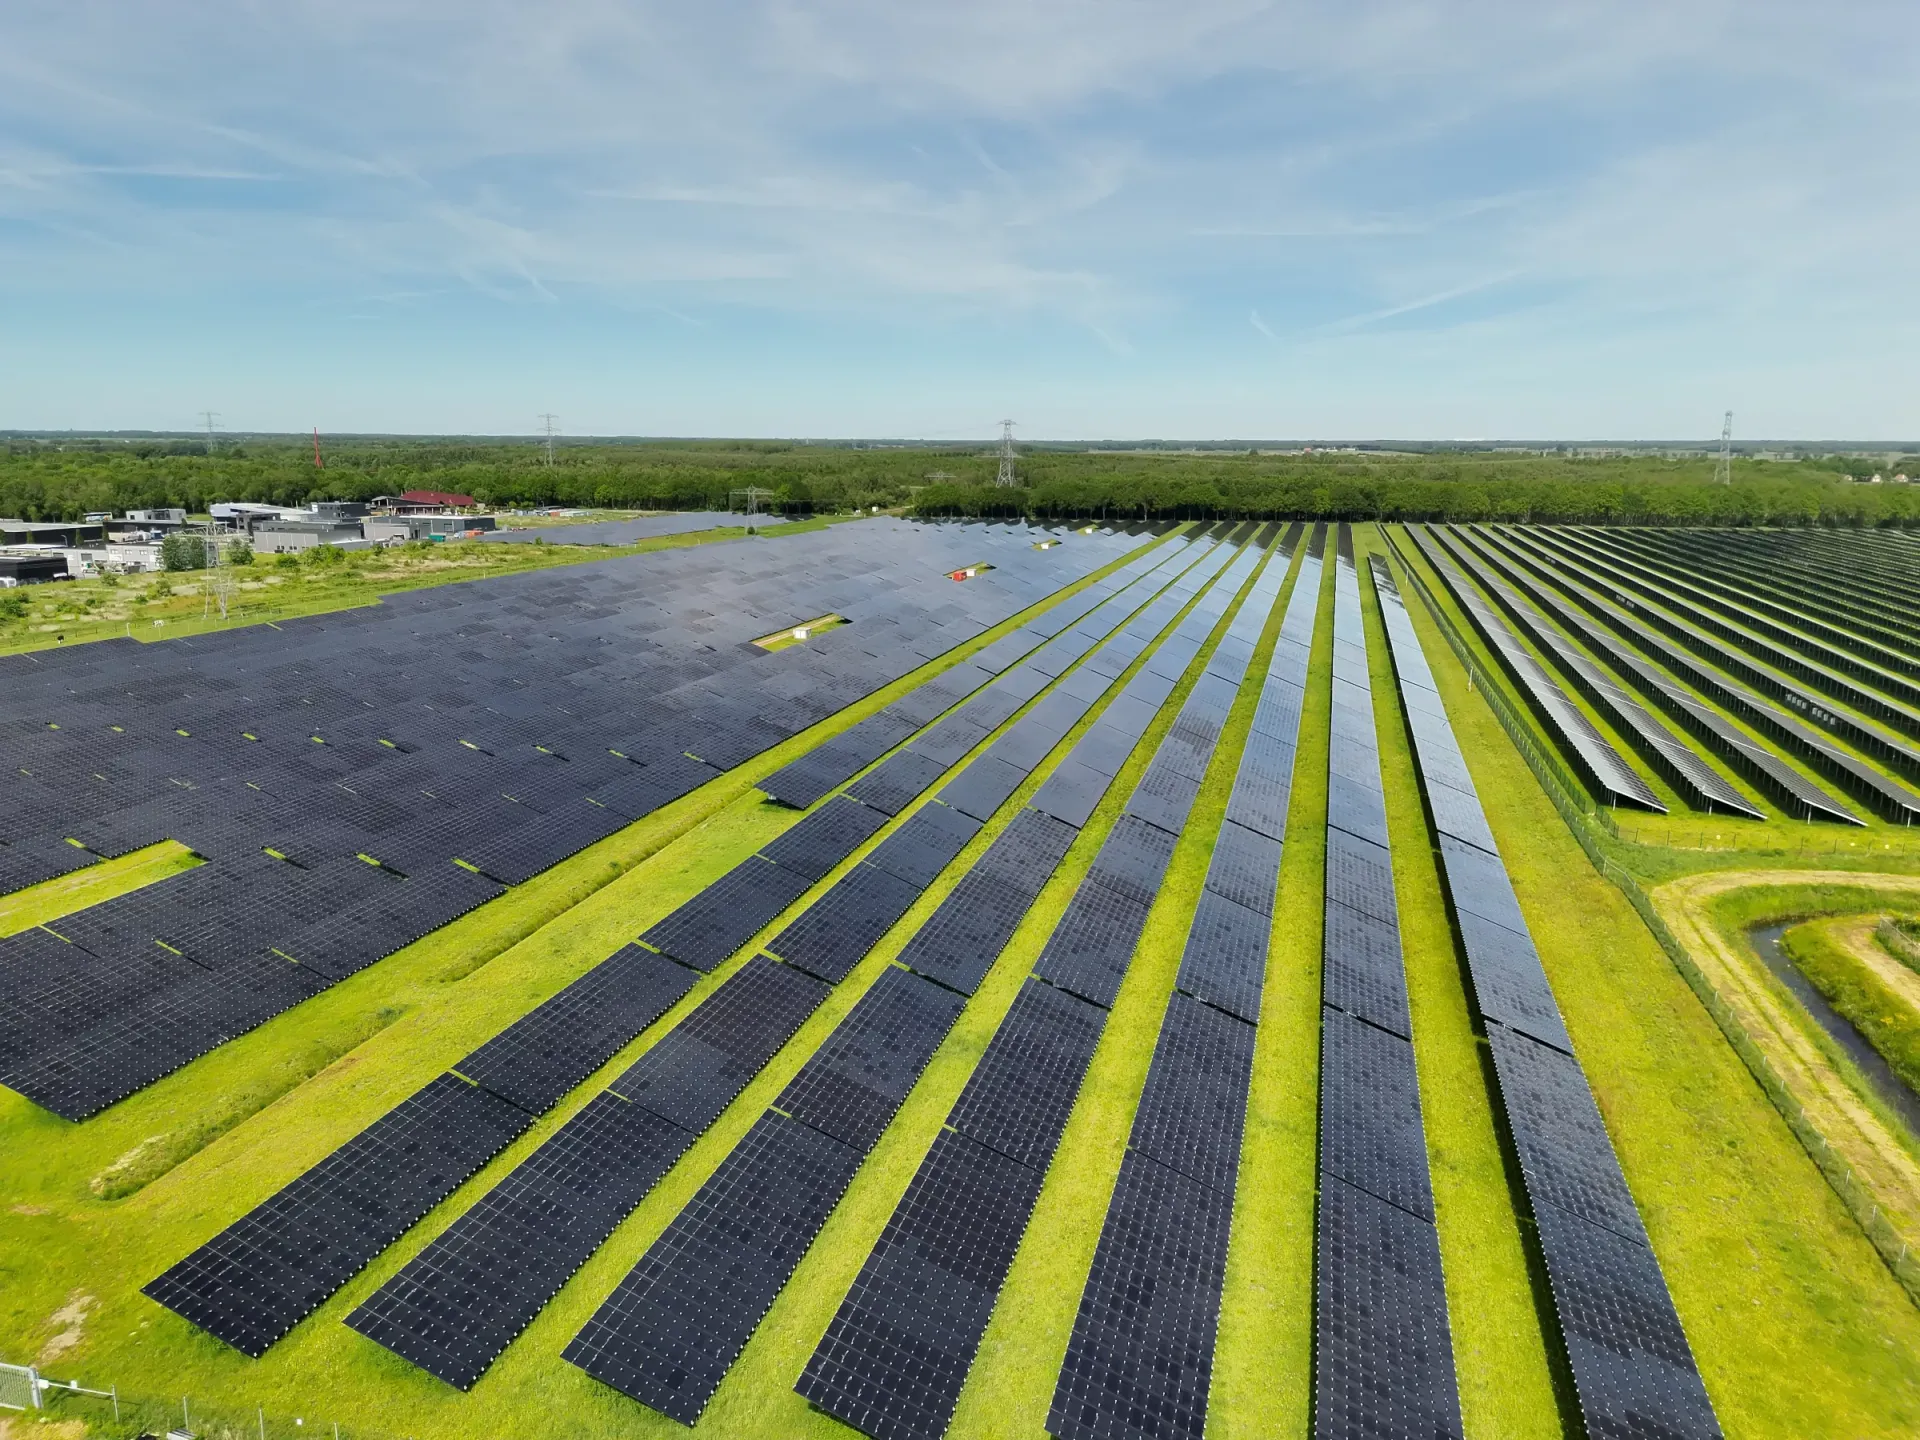
A complete thermographic drone inspection of a large-scale solar park complex in Groningen — 400 km away. What the client sees is a clear report. What goes into it, you can read below.
Preparation — several days before the mission
An assignment like this doesn't start the night before. Three pillars are reviewed simultaneously: the location, the airspace, and the weather. That combination determines whether a mission is feasible — and if so, when.
CTR zones, temporary restrictions, and helicopter routes are checked. For a location in the Netherlands, I submit an authorisation request with the competent authority — a separate process with its own documentation requirements as a recognised operator. The weather forecast is then monitored hour by hour and location by location. The mission is only confirmed once the weather window allows it.
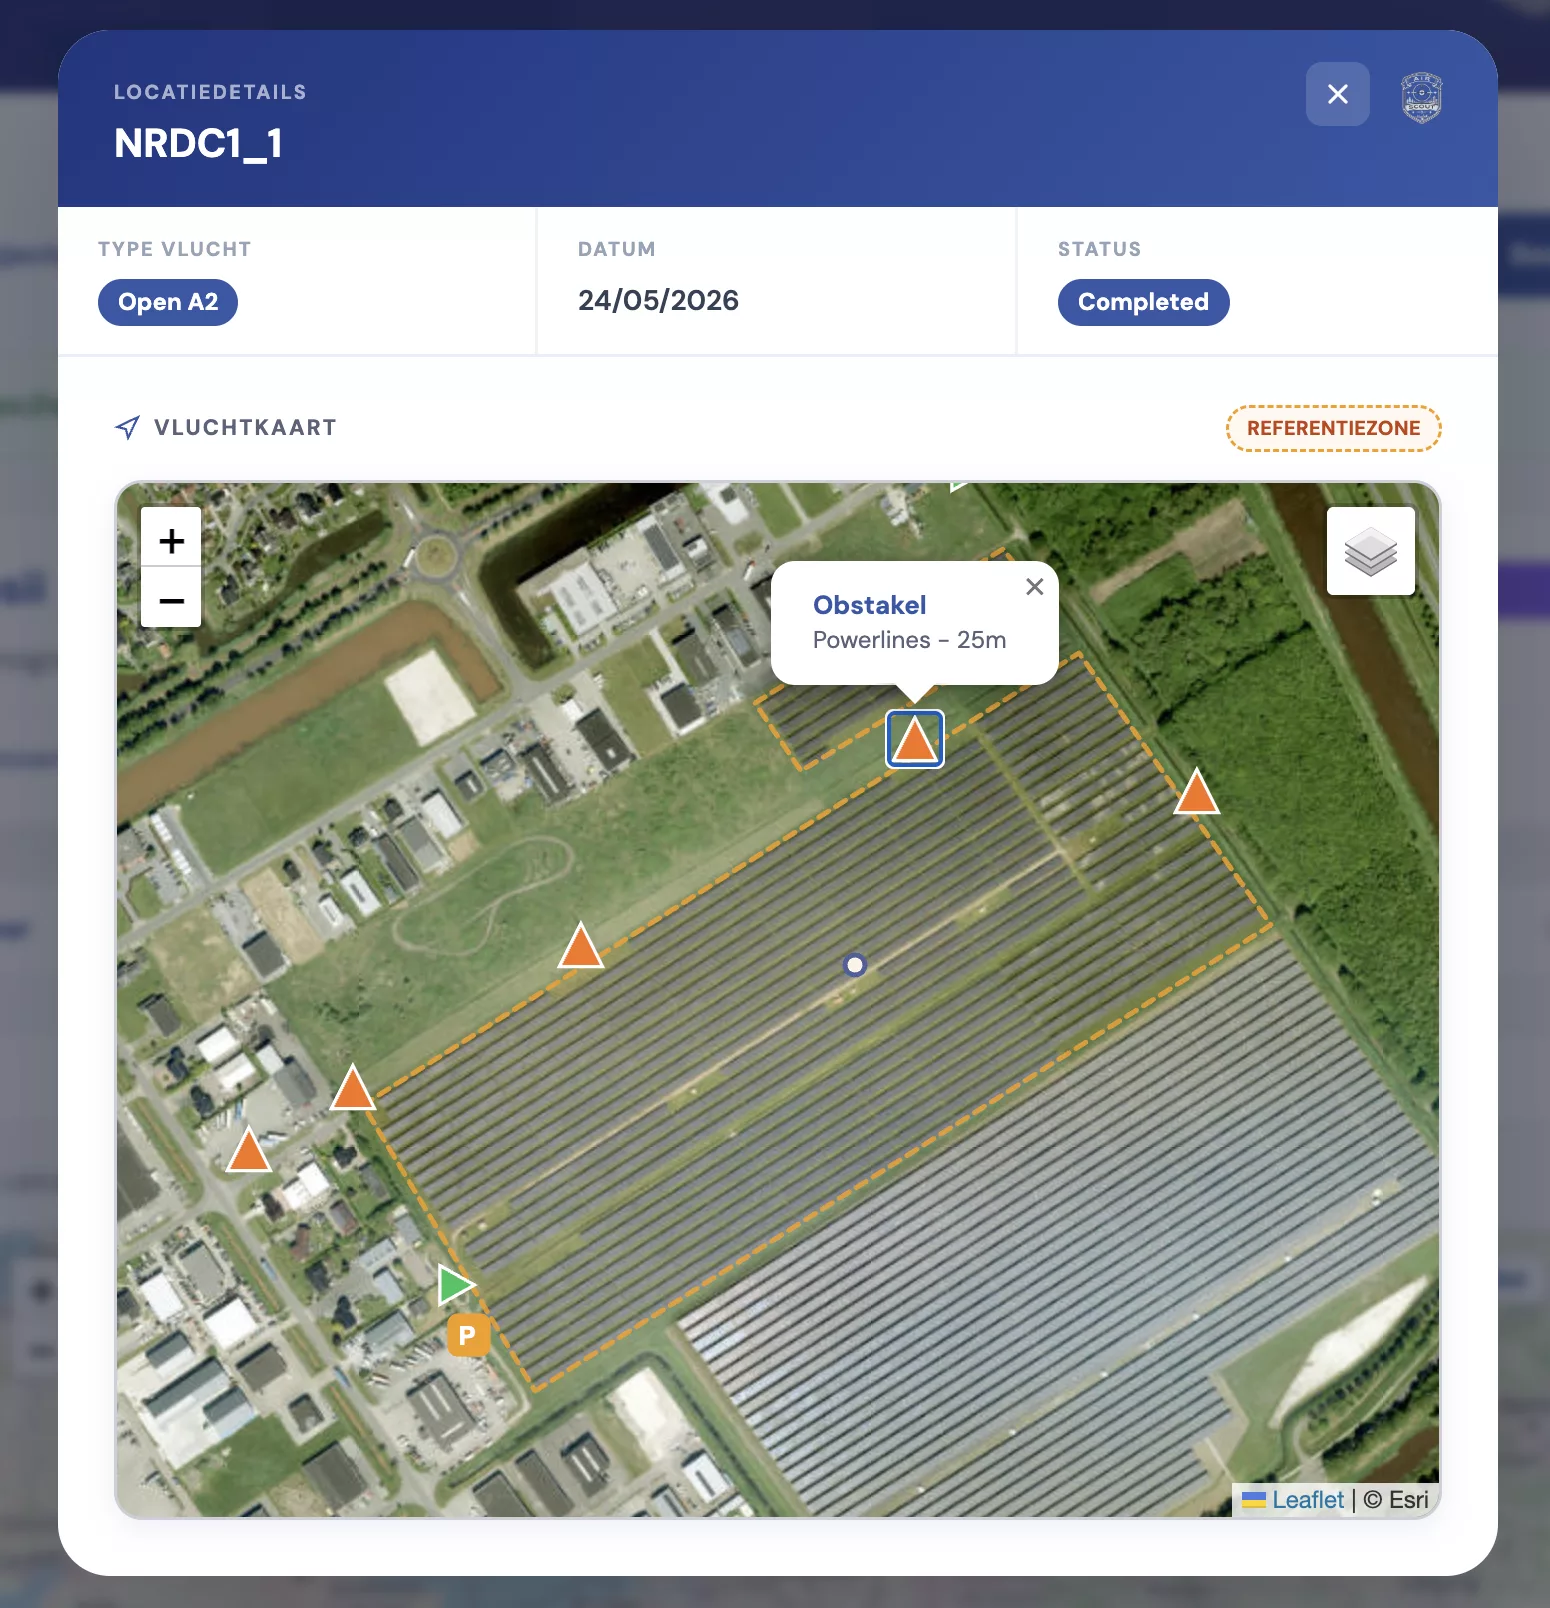
The location is thoroughly reviewed via satellite imagery. Power lines, trees, buildings, and fences are identified. Each obstacle receives an estimated height and is translated into a safety margin in the flight plan.
CTR zones, temporary restrictions, and helicopter routes are checked. For the Netherlands, an authorisation request is submitted with the competent authority — a separate process as a recognised operator.
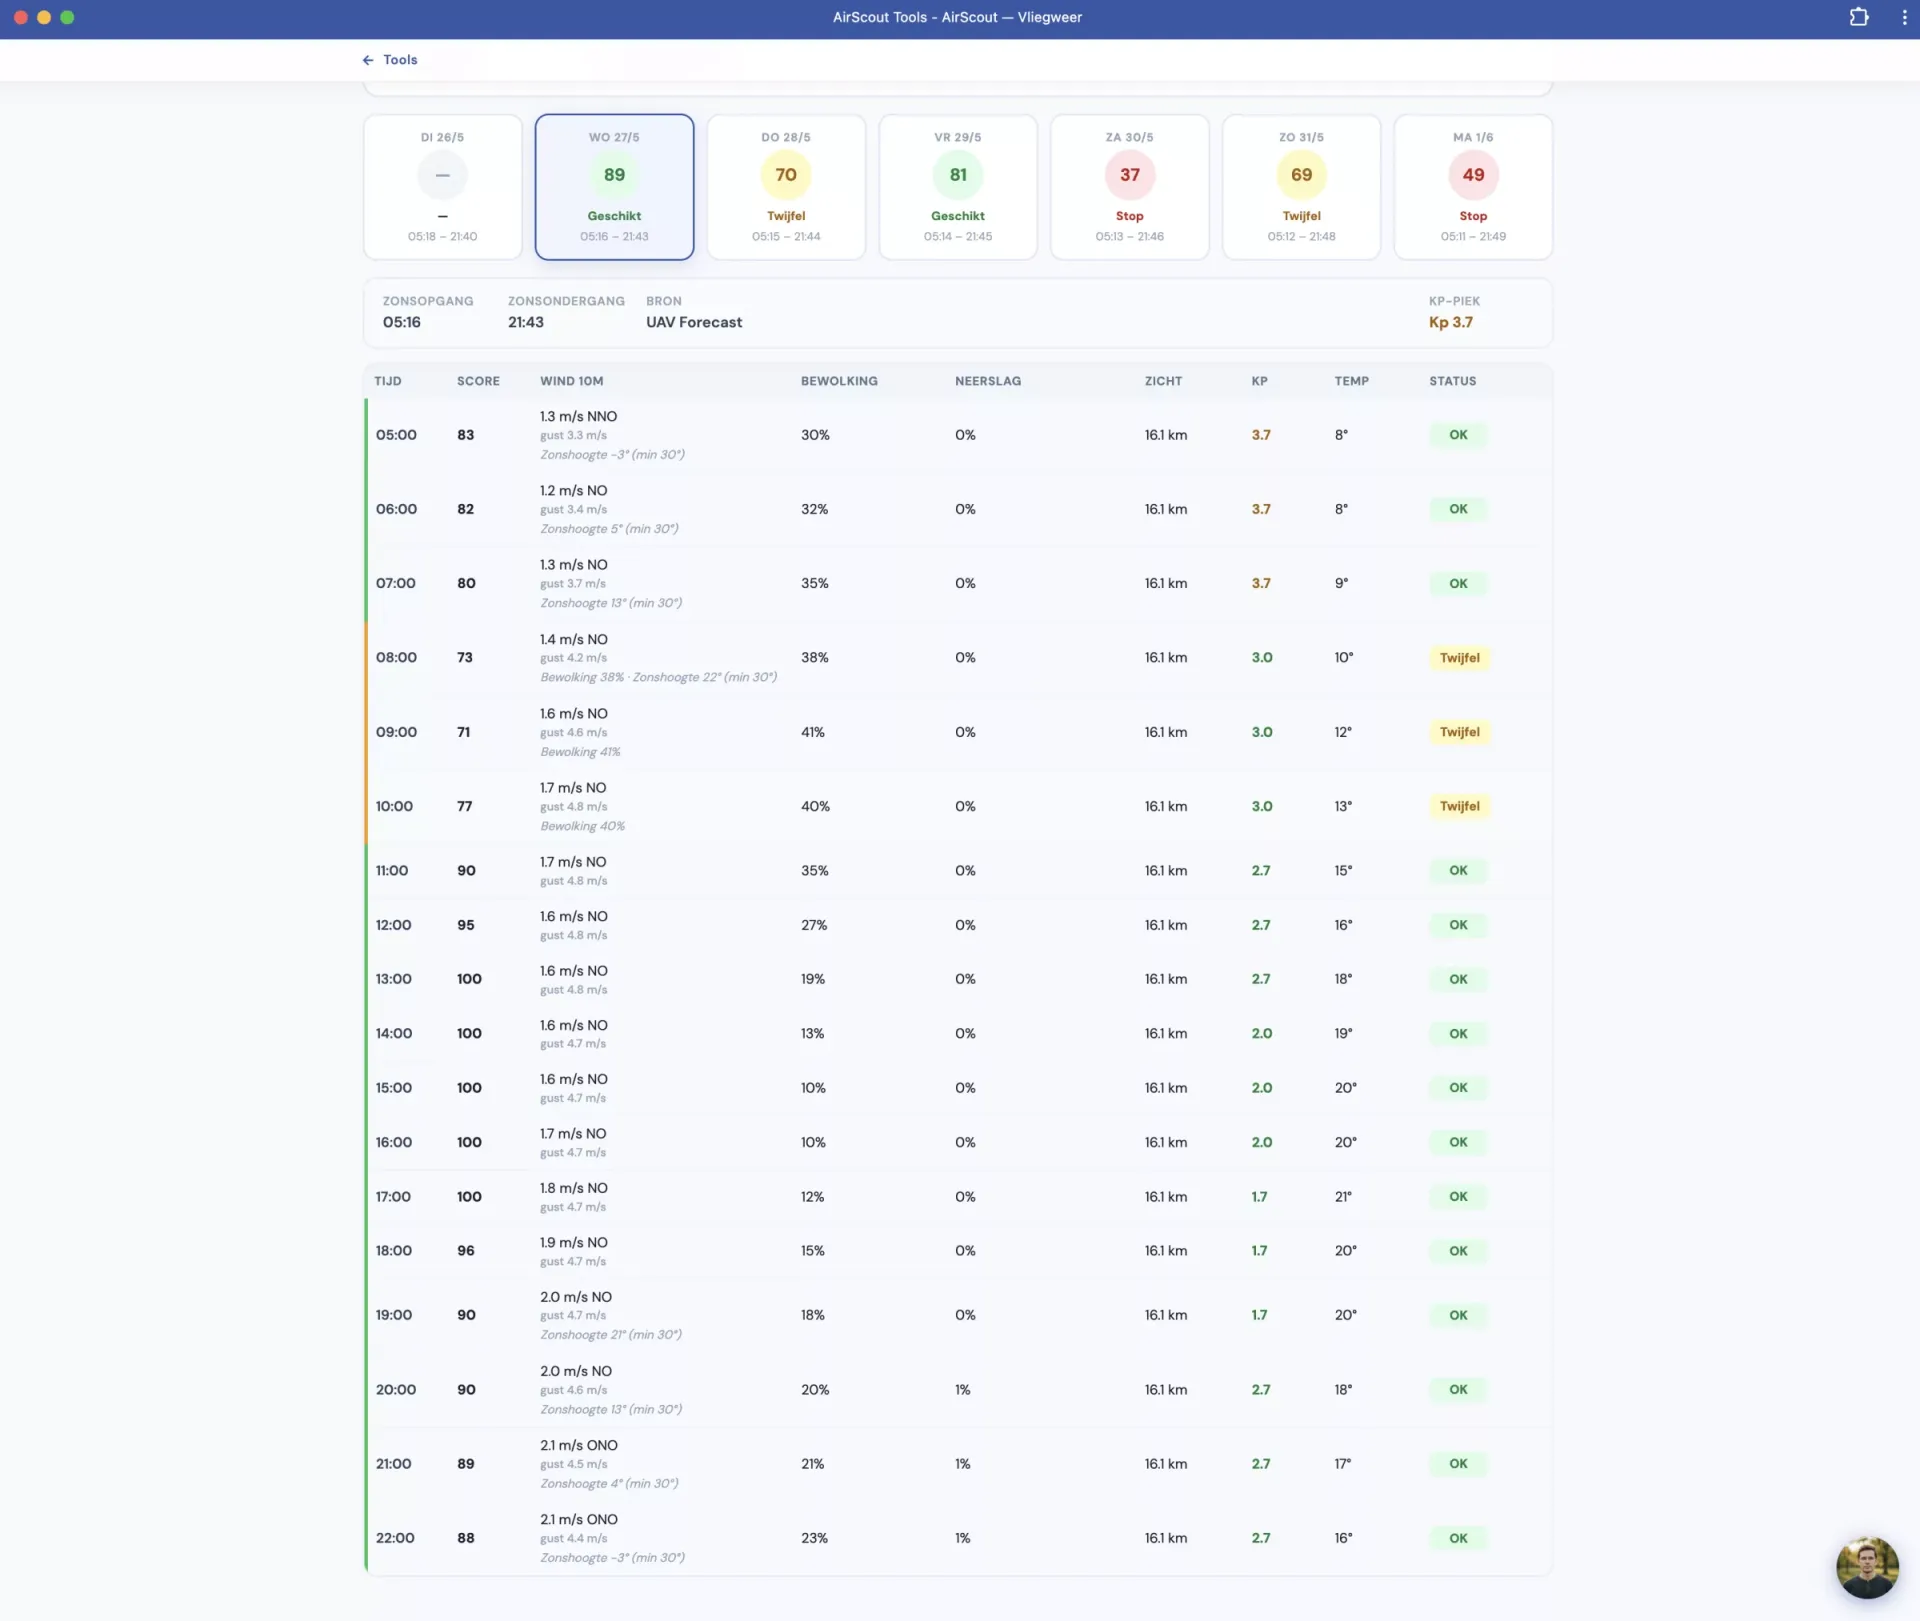
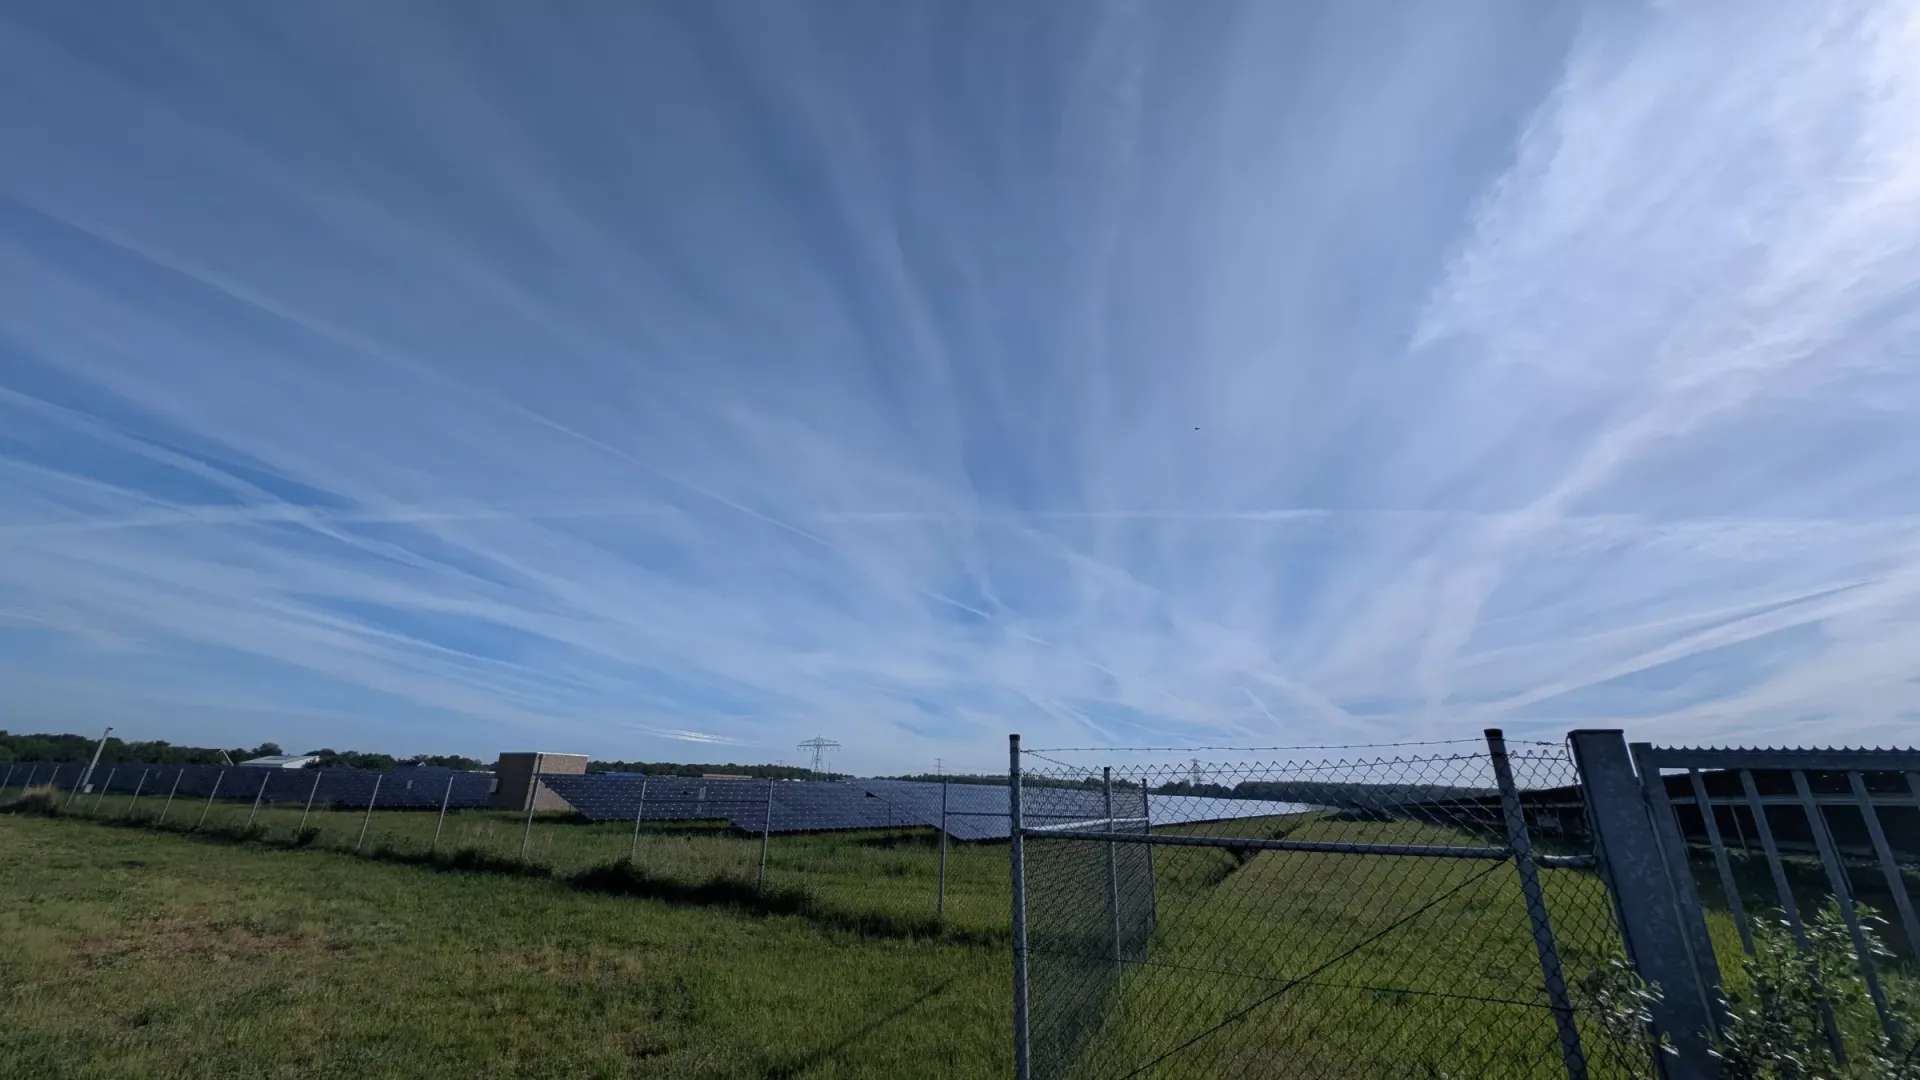
Thermography works best under stable conditions. Too much wind cools the panels and masks anomalies. The forecast is monitored days in advance, hour by hour and location by location.
Arrival — testing theory against reality
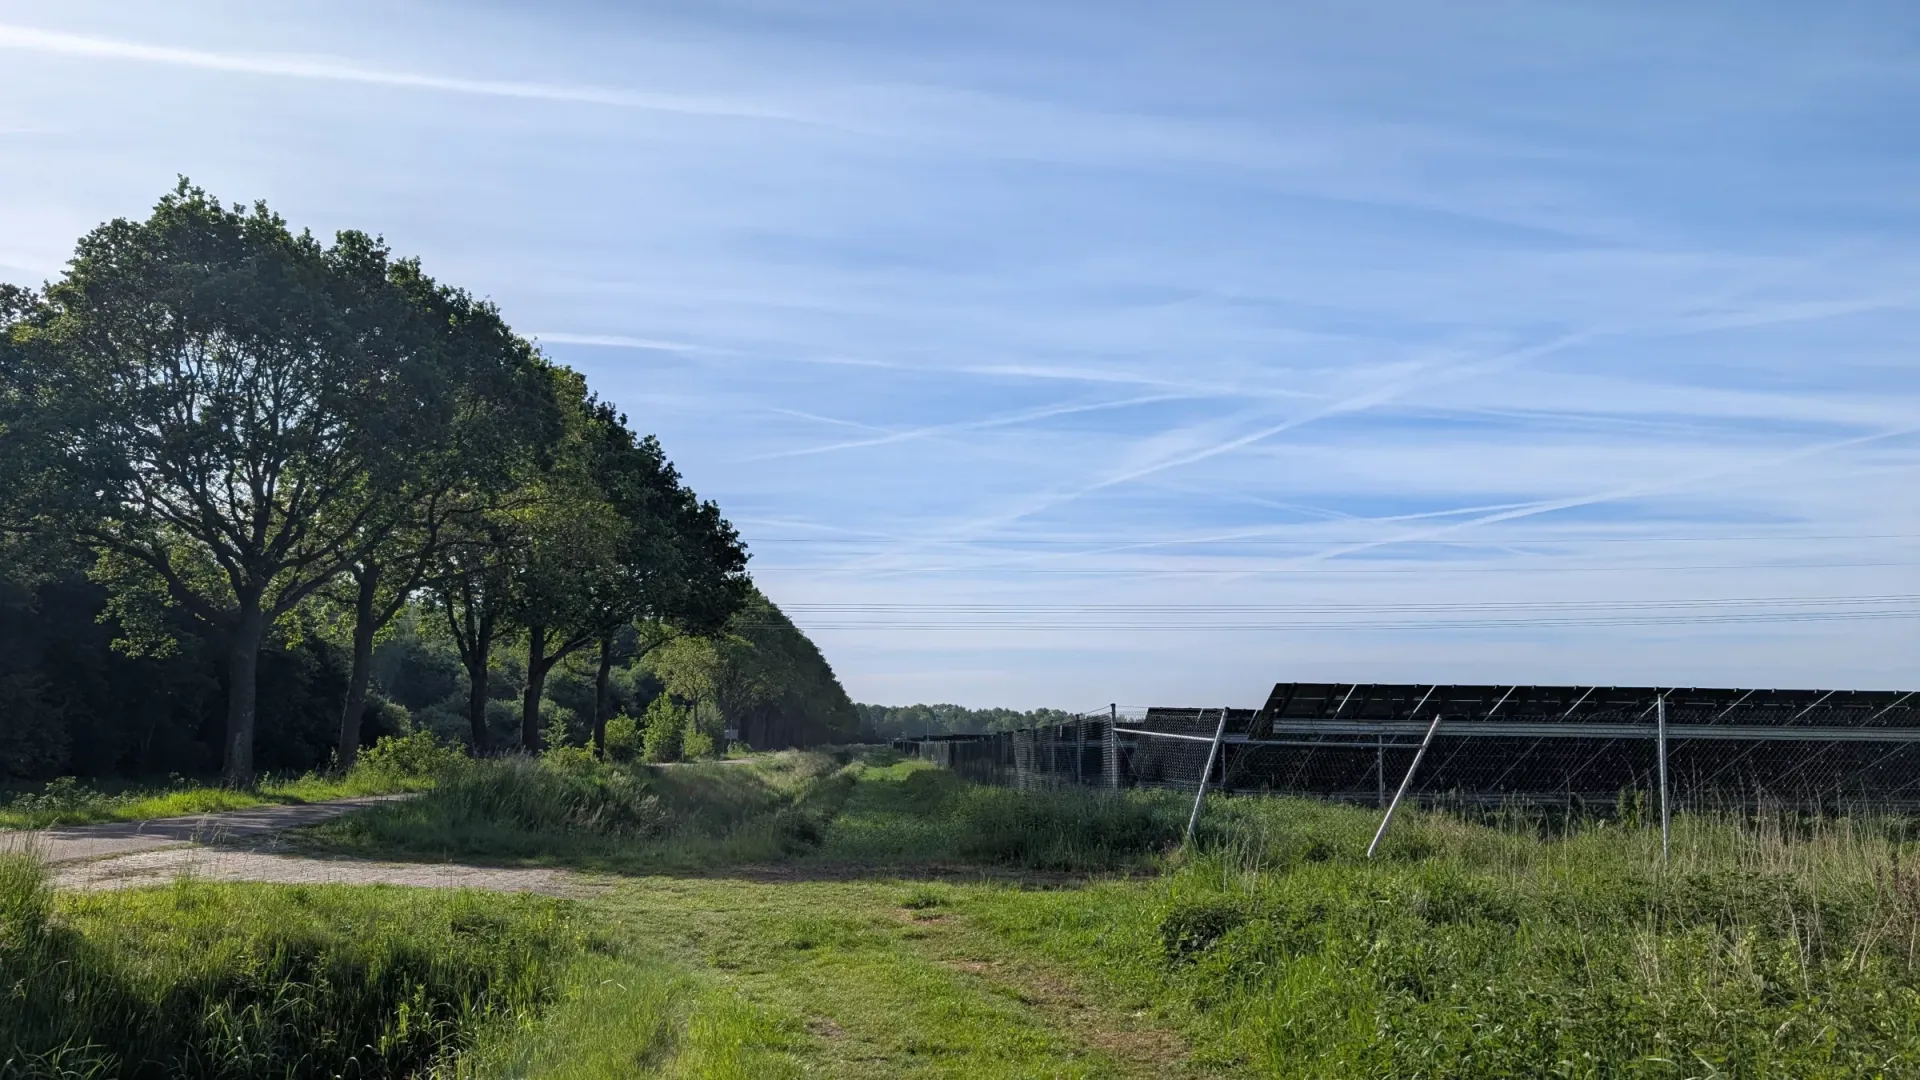
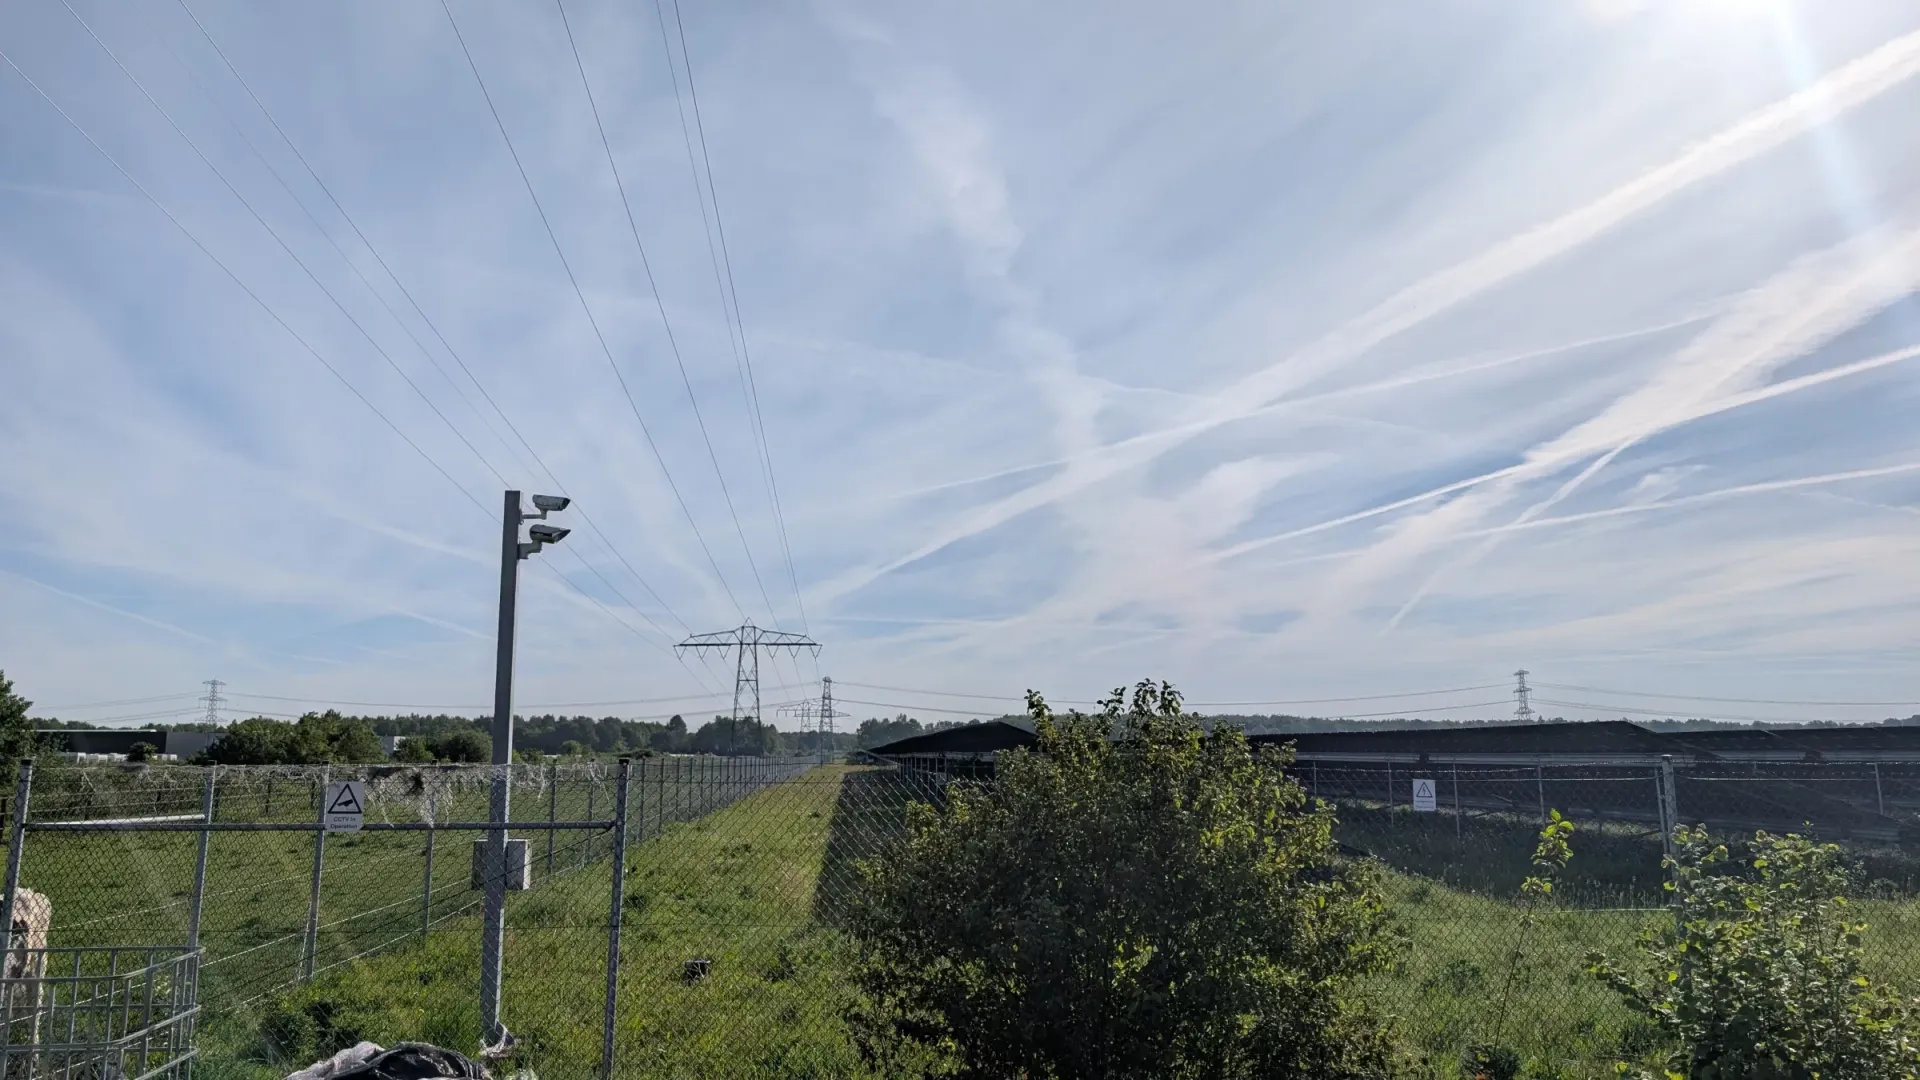
Preparation is one thing. Reality on site is another. On arrival, I first walk the perimeter on foot. Satellite imagery doesn't always convey accurate height information — a power line tower that looks small on the map can tell a very different story in the field.
That site walkthrough is also the moment when documentation is finalised. Everything is recorded so the operational log is fully consistent afterwards. Only once reality matches the preparation — or the plan has been adjusted — does the drone go up.
- Are the power line towers as tall as estimated?
- How close are the trees along the perimeter?
- Are there any new obstacles not yet shown on the map?
- Adjust the flight plan if needed — define the flight zone and confirm the starting point
On-site meteorological measurements
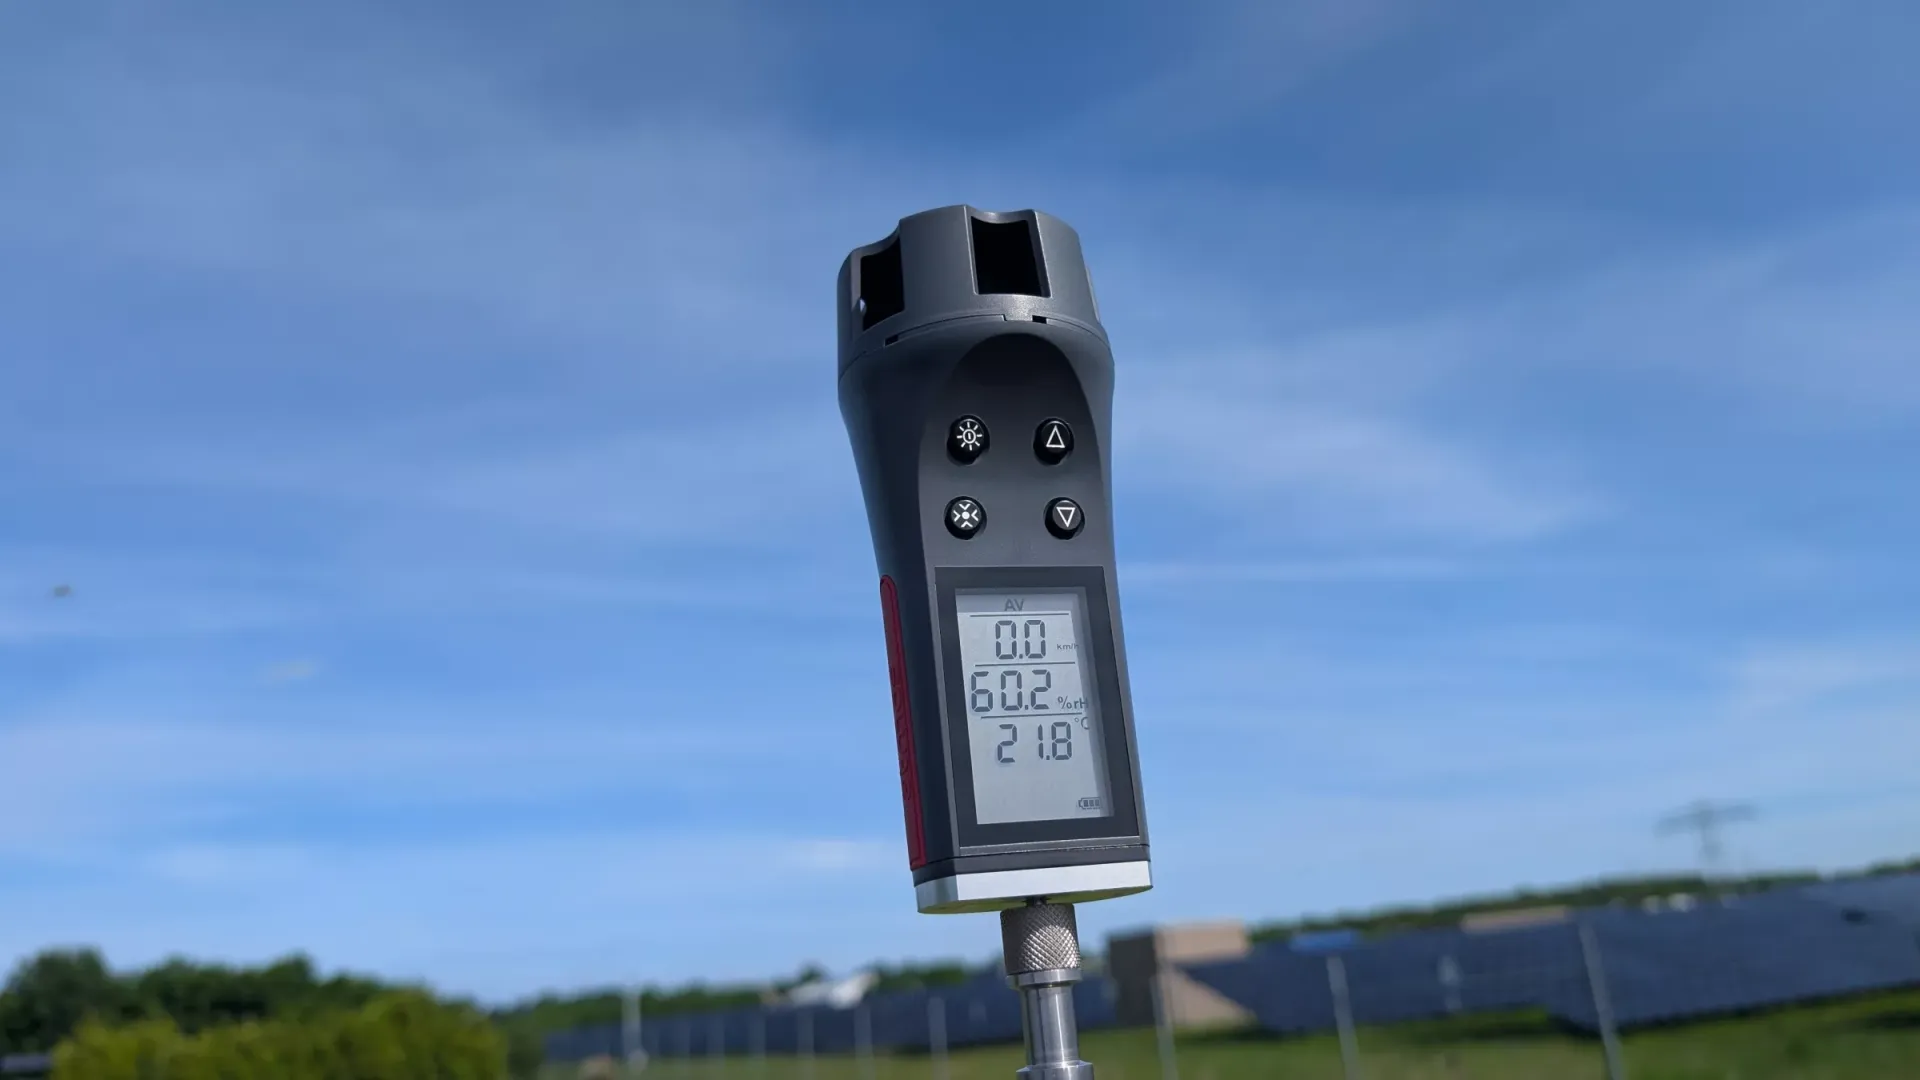
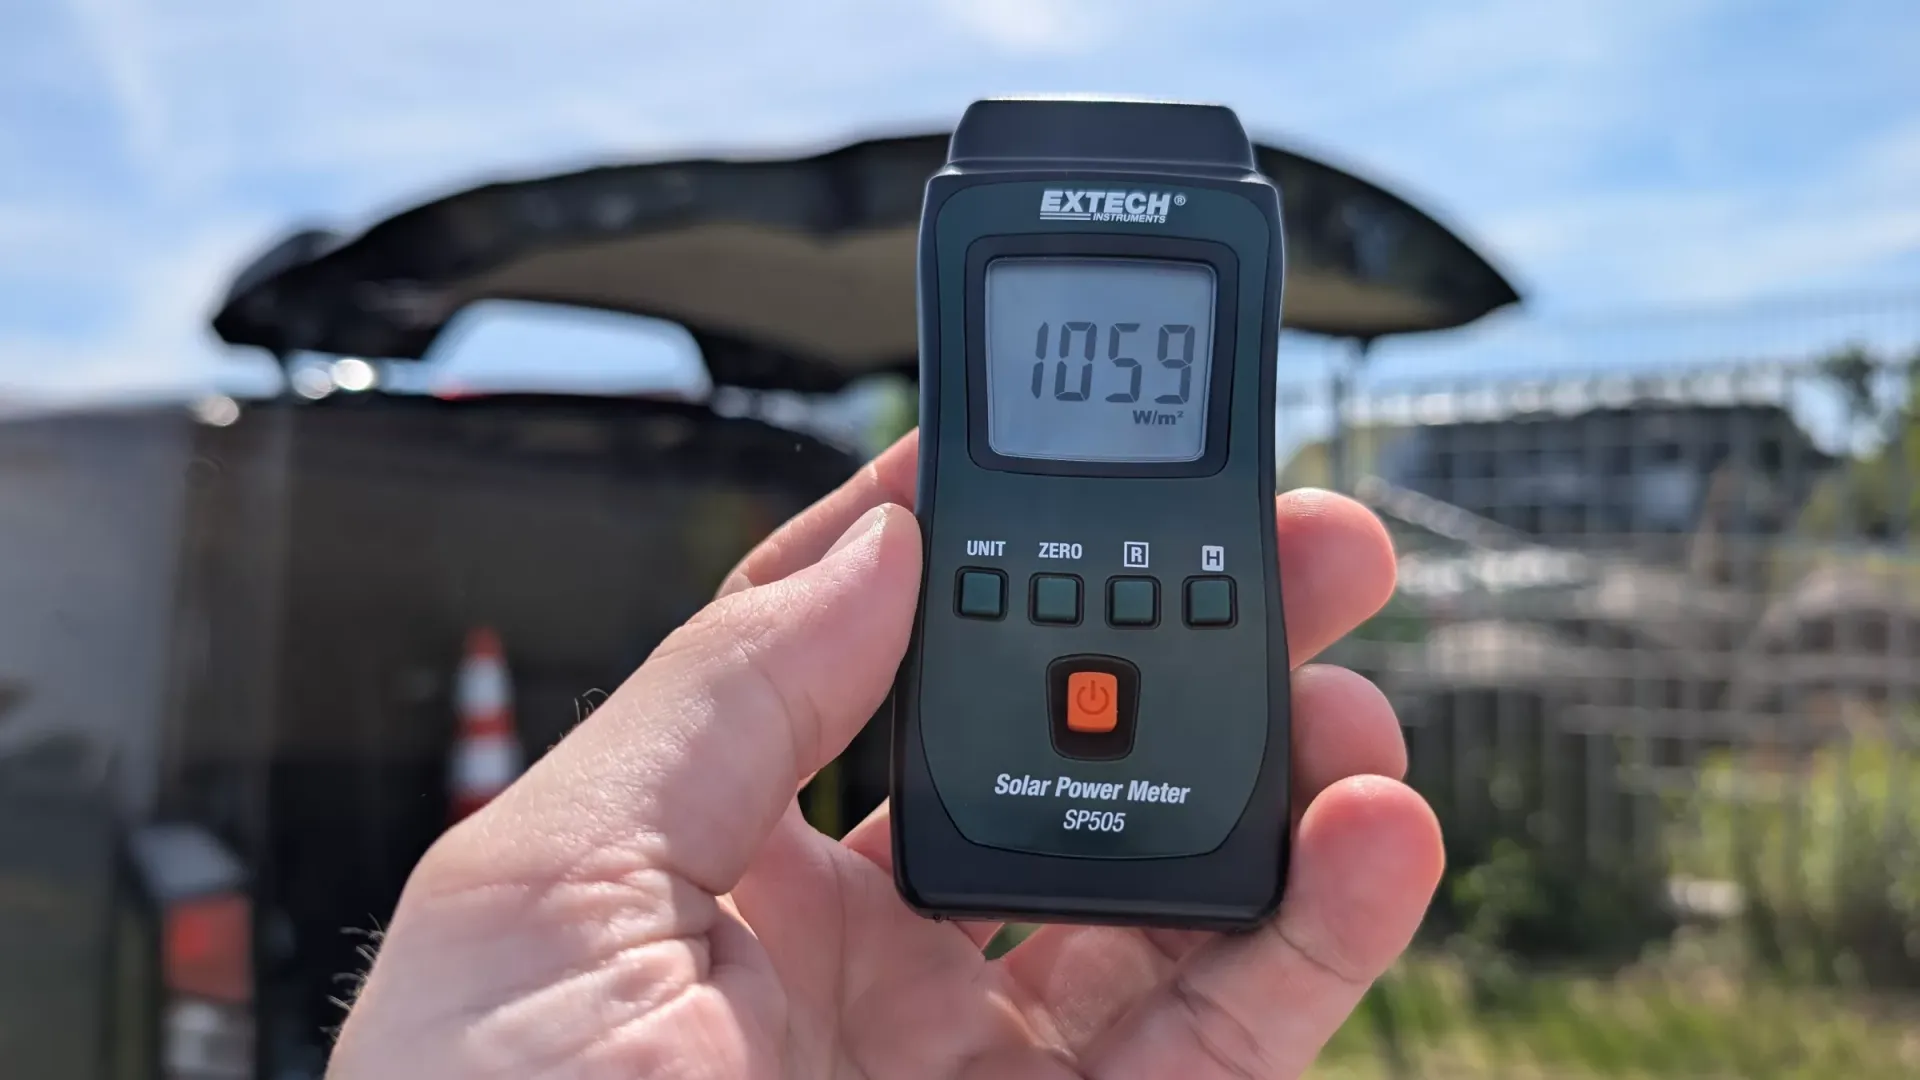
In addition to digital weather data, field measurements are taken on site. These values are included in the report so the client knows exactly under what conditions the inspection took place — a requirement for reproducible results.
An anemometer measures wind speed at flight altitude. Too much wind cools the panels and masks thermal anomalies. The pyranometer showed 1,059 W/m² at the time of the flight — well above the 600 W/m² minimum threshold for reliable thermographic inspection.
Compliant with IEC 62446-3 standard
The logistics behind the scenes
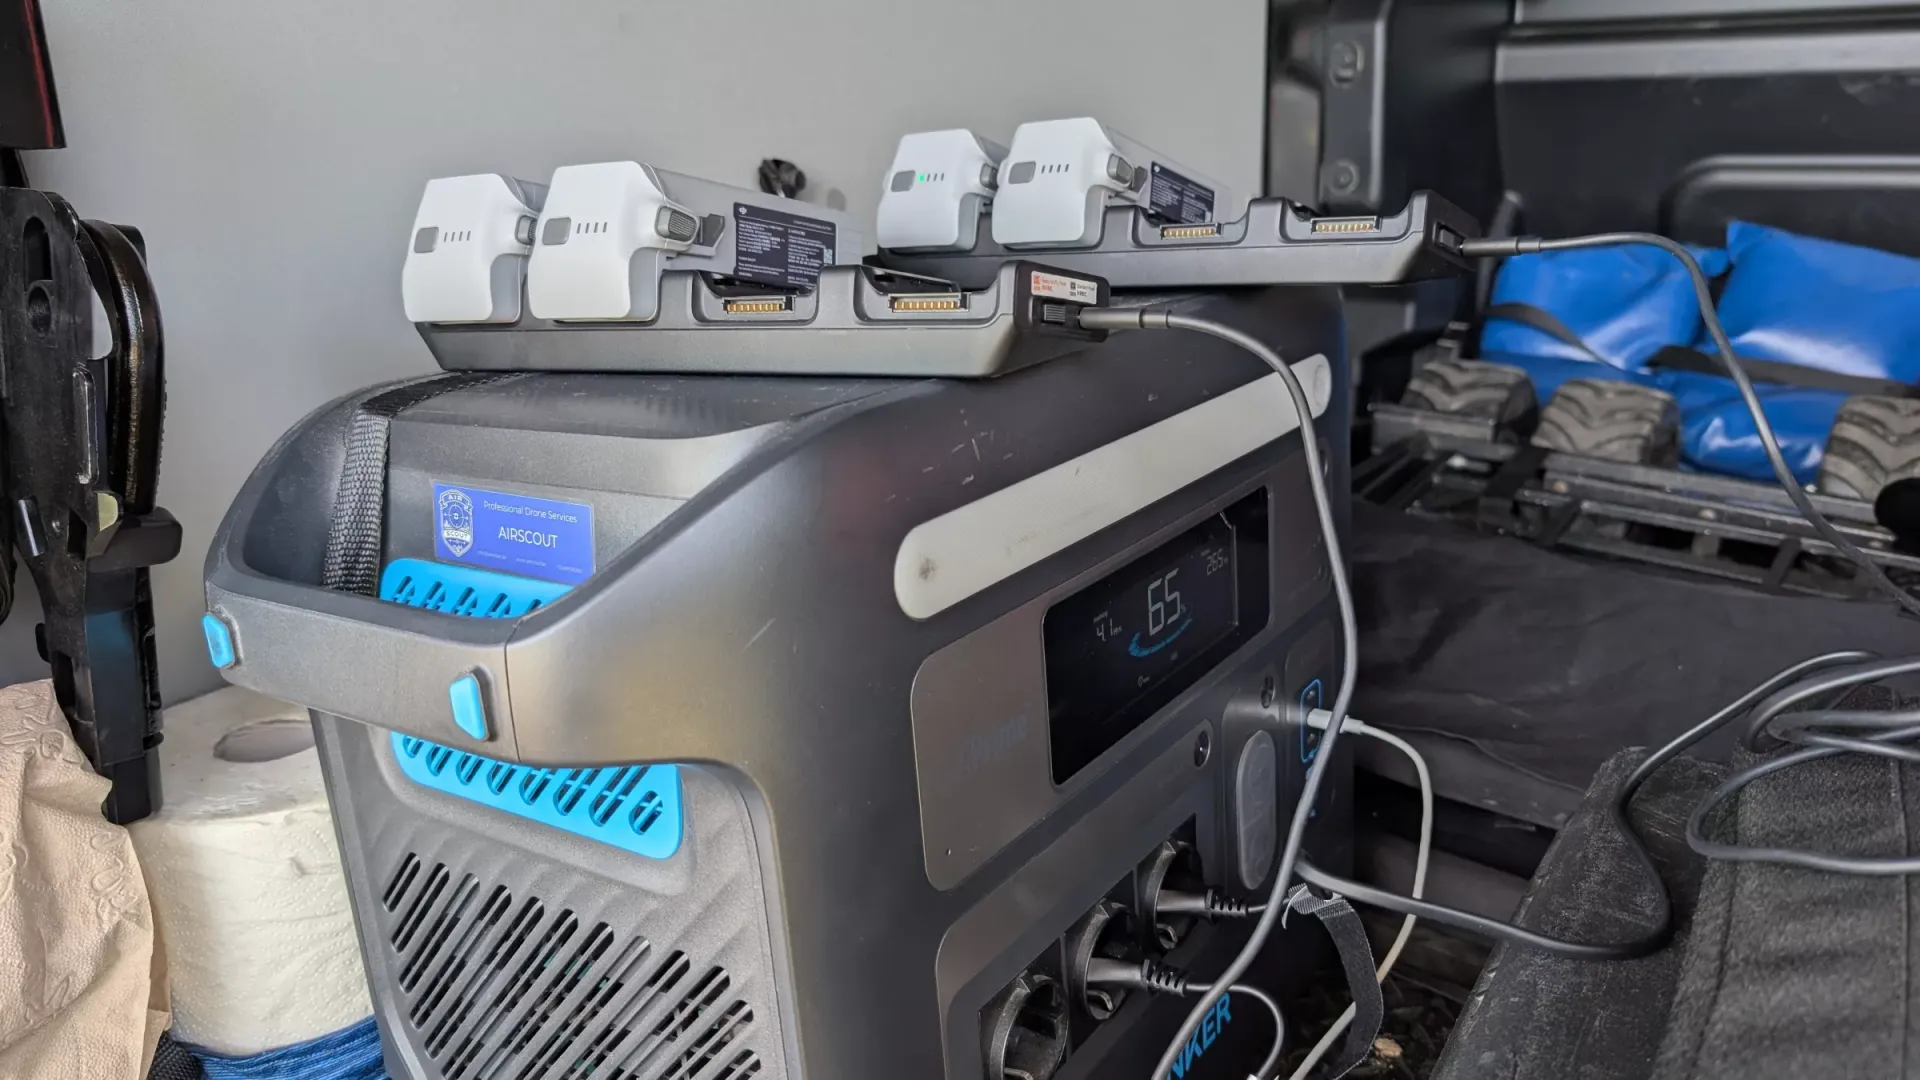
A full-day operation 400 km away requires material and energy preparation. The drone needs multiple batteries to cover a surface this large — they are continuously swapped and recharged from a mobile power station in the vehicle.
No grid connection required, fully autonomous on site. This makes it possible to operate in remote locations without depending on external infrastructure.
For smaller installations, multiple sites are combined in a single day — sometimes crossing the entire country. The preparation per location is equally thorough; only the logistics require tighter planning.
Custom tools for planning and monitoring
To manage preparation efficiently, internal tools have been developed specifically tailored to professional drone operations. Not generic software — but tools that do exactly what an assignment requires.
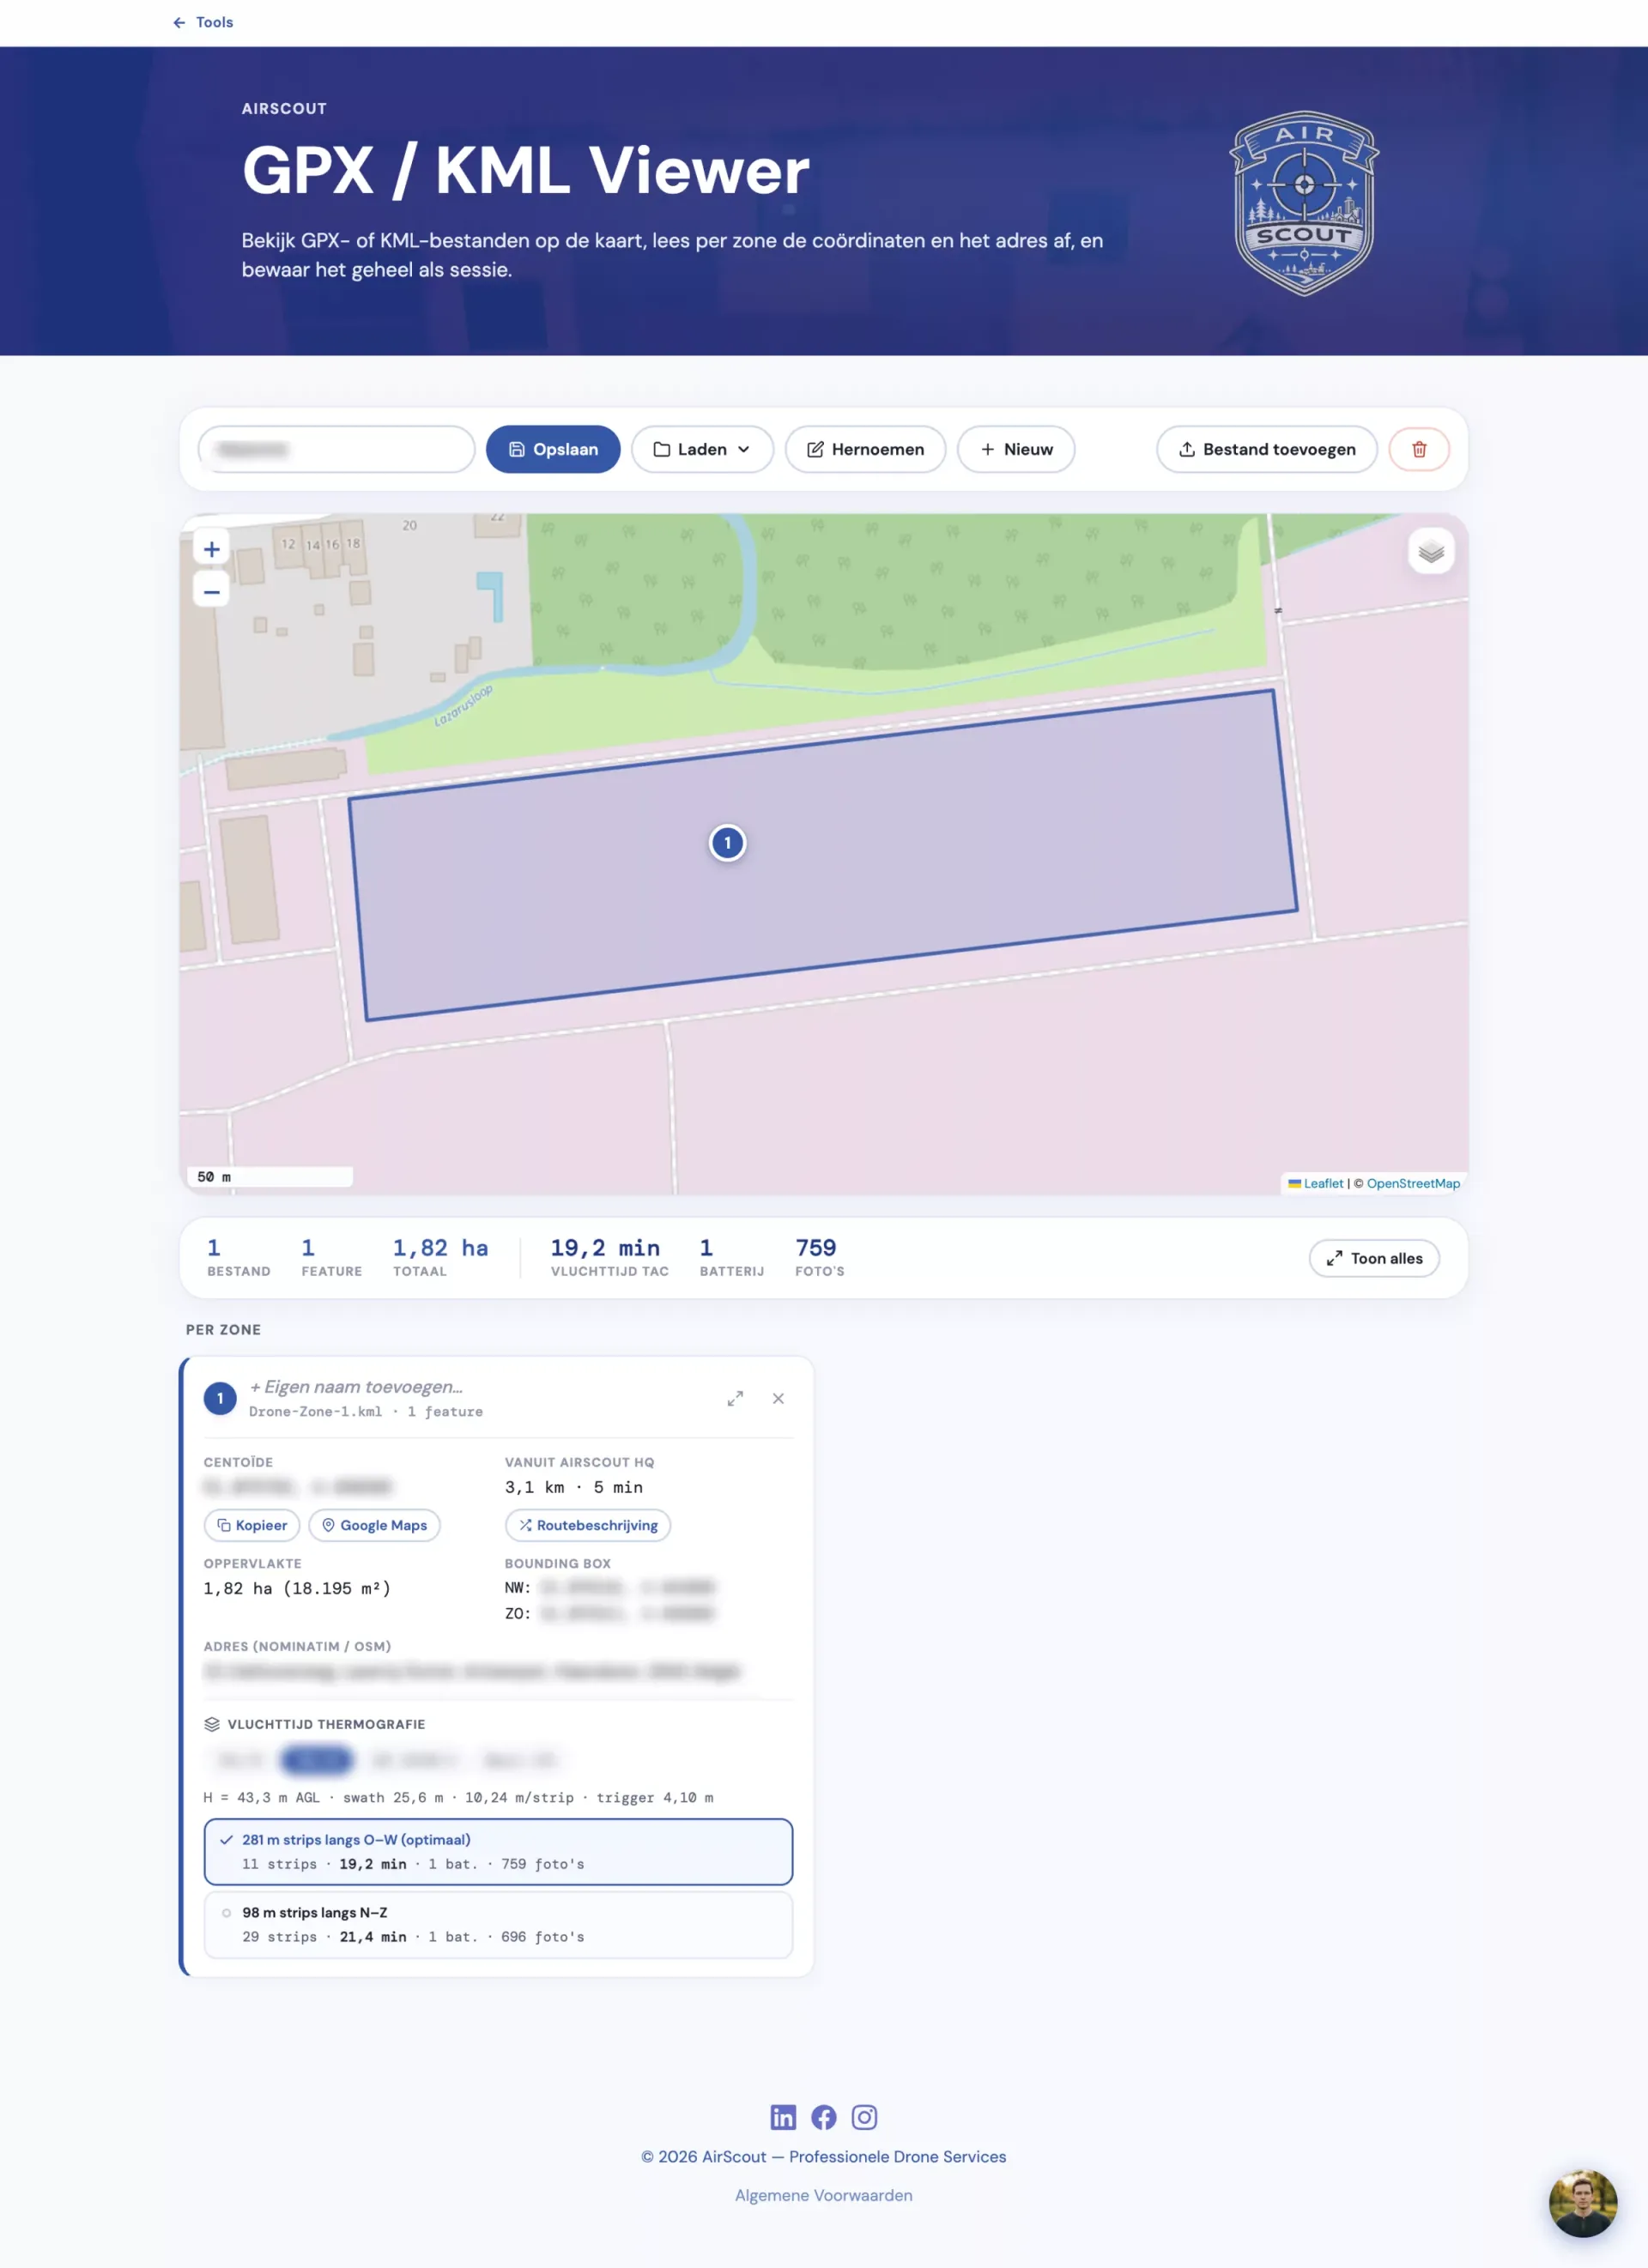
Through the GPX/KML Viewer, the flight zone is loaded and a complete overview appears instantly: area, centroid, address, and distance driving distance. Flight time, strips, optimal direction, batteries, and expected number of photos are calculated automatically.
These calculations are indicative — reality on site always varies slightly — but they provide a solid basis in advance for estimating a day, briefing the client, and planning logistics.
Load flight zones, calculate areas and distances, determine optimal flight direction.
Automatic calculation of strips, flight time, batteries, and photos based on zone and parameters.
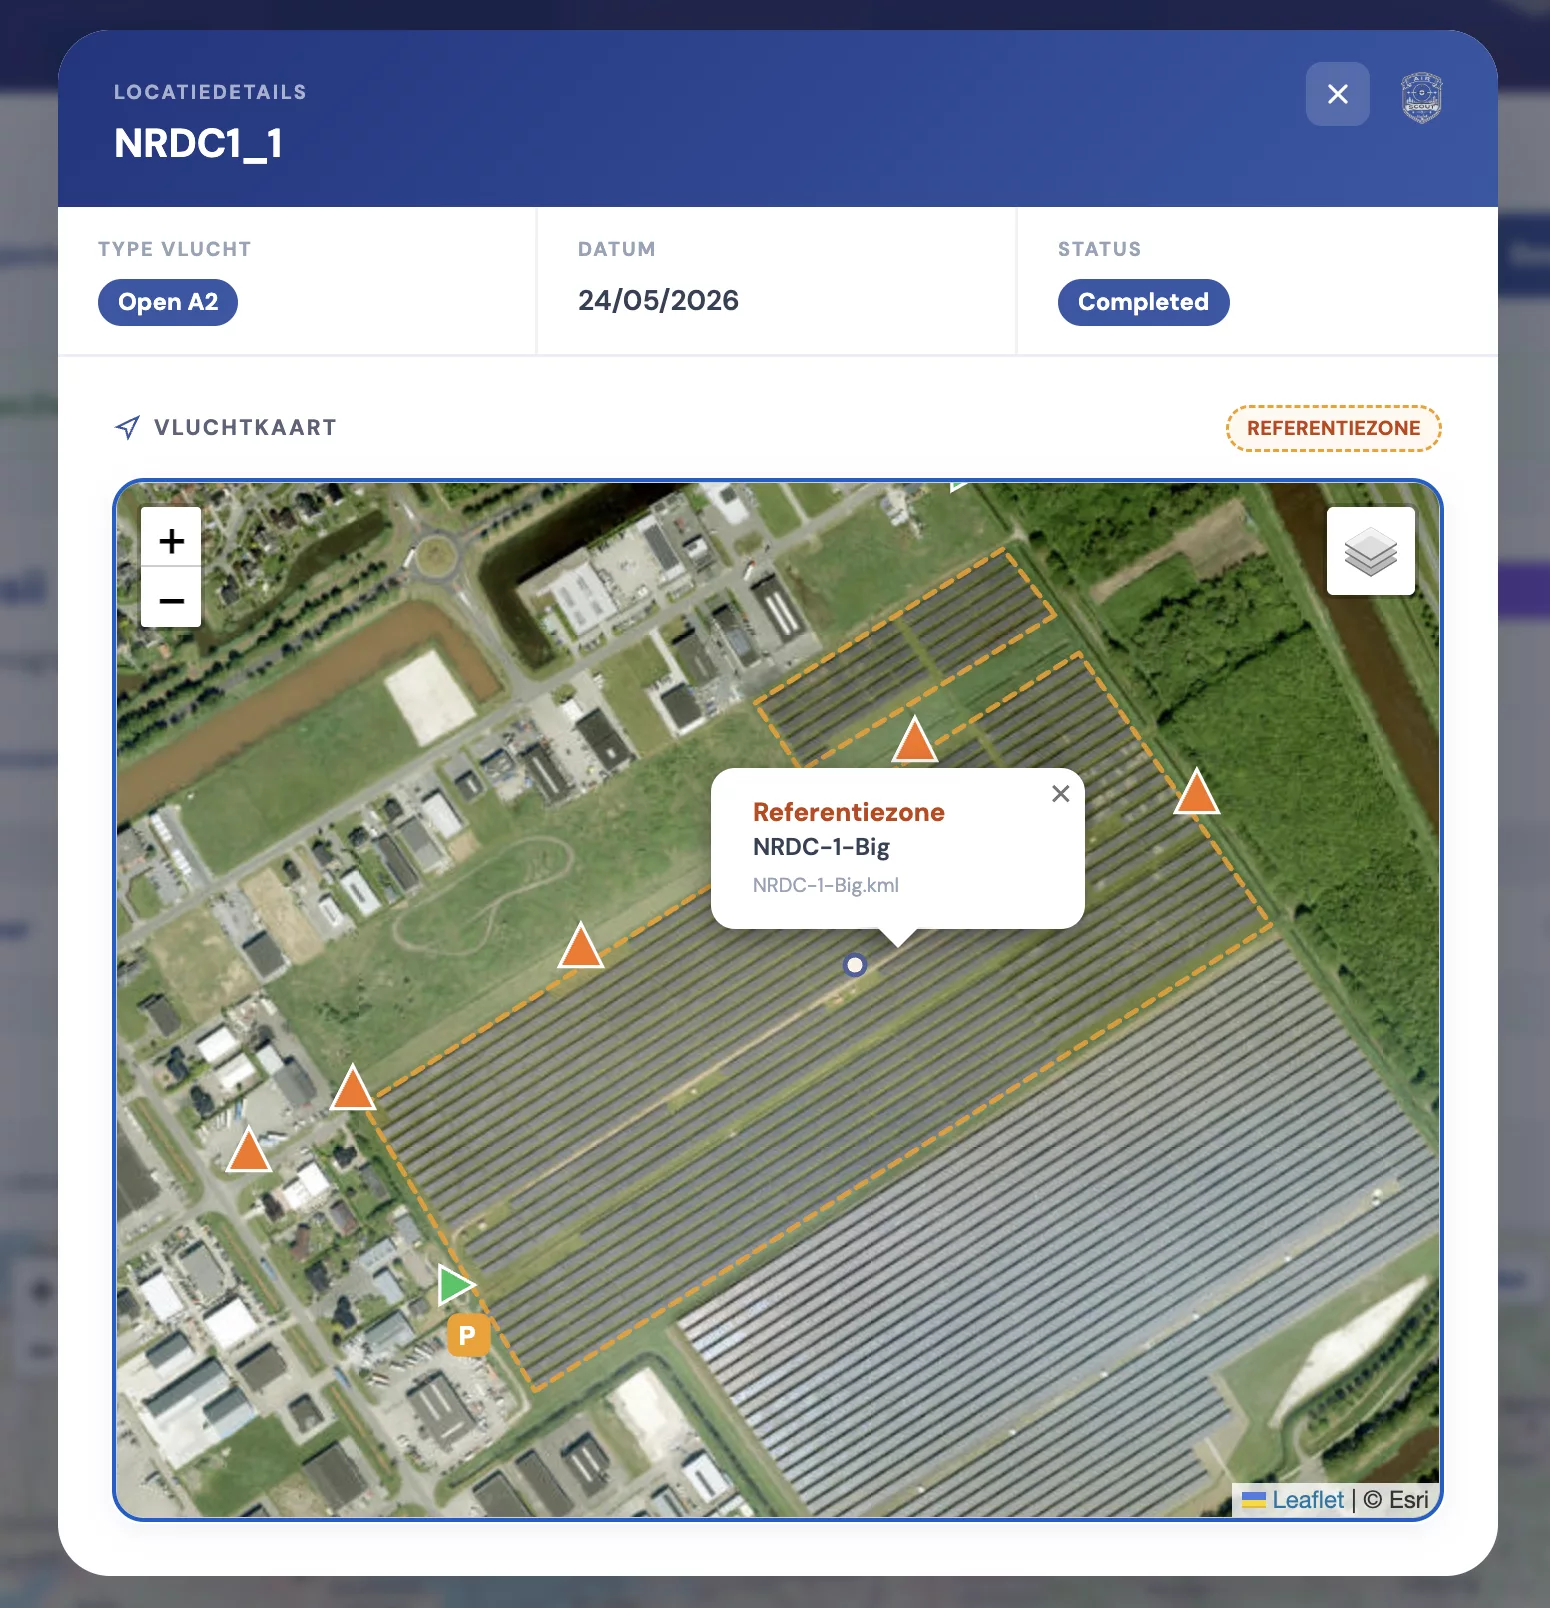
Locations, obstacles, starting points, and reference zones are tracked visually per assignment.
Integrated weather check per location with hourly scores for wind, cloud cover, and solar irradiance.
The flight itself
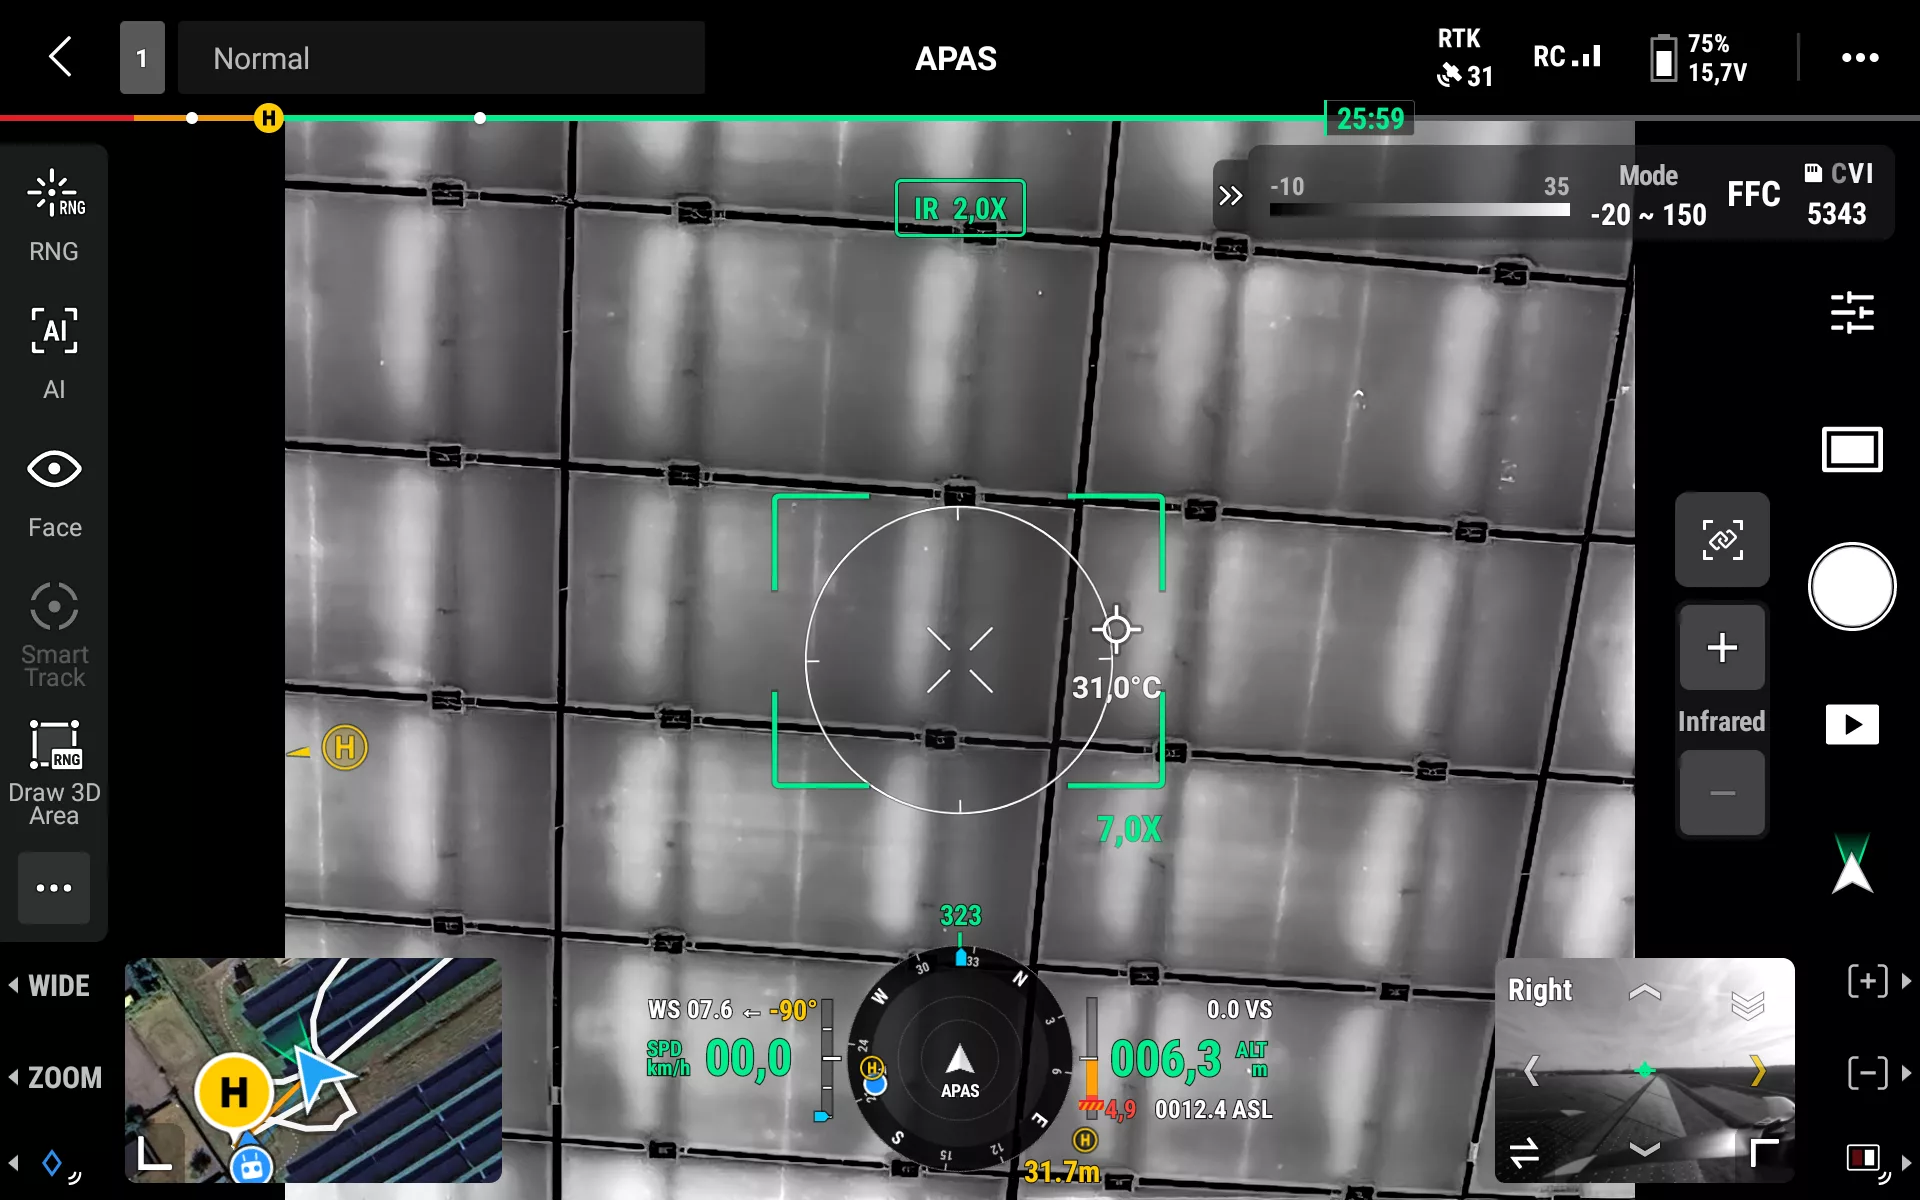
The drone flies a pre-programmed grid — automatically, but under constant visual supervision. The DJI Matrice 4T captures simultaneous visual and radiometric thermal images. Flight speed, overlap, and GSD are precisely calibrated to the required accuracy and specific panel layout.
For a park of this size, this means multiple flight blocks, each with a fresh battery. The planning accounts for the solar angle throughout the day — flying too early or too late creates long panel shadows that disturb the thermal measurement.
The output
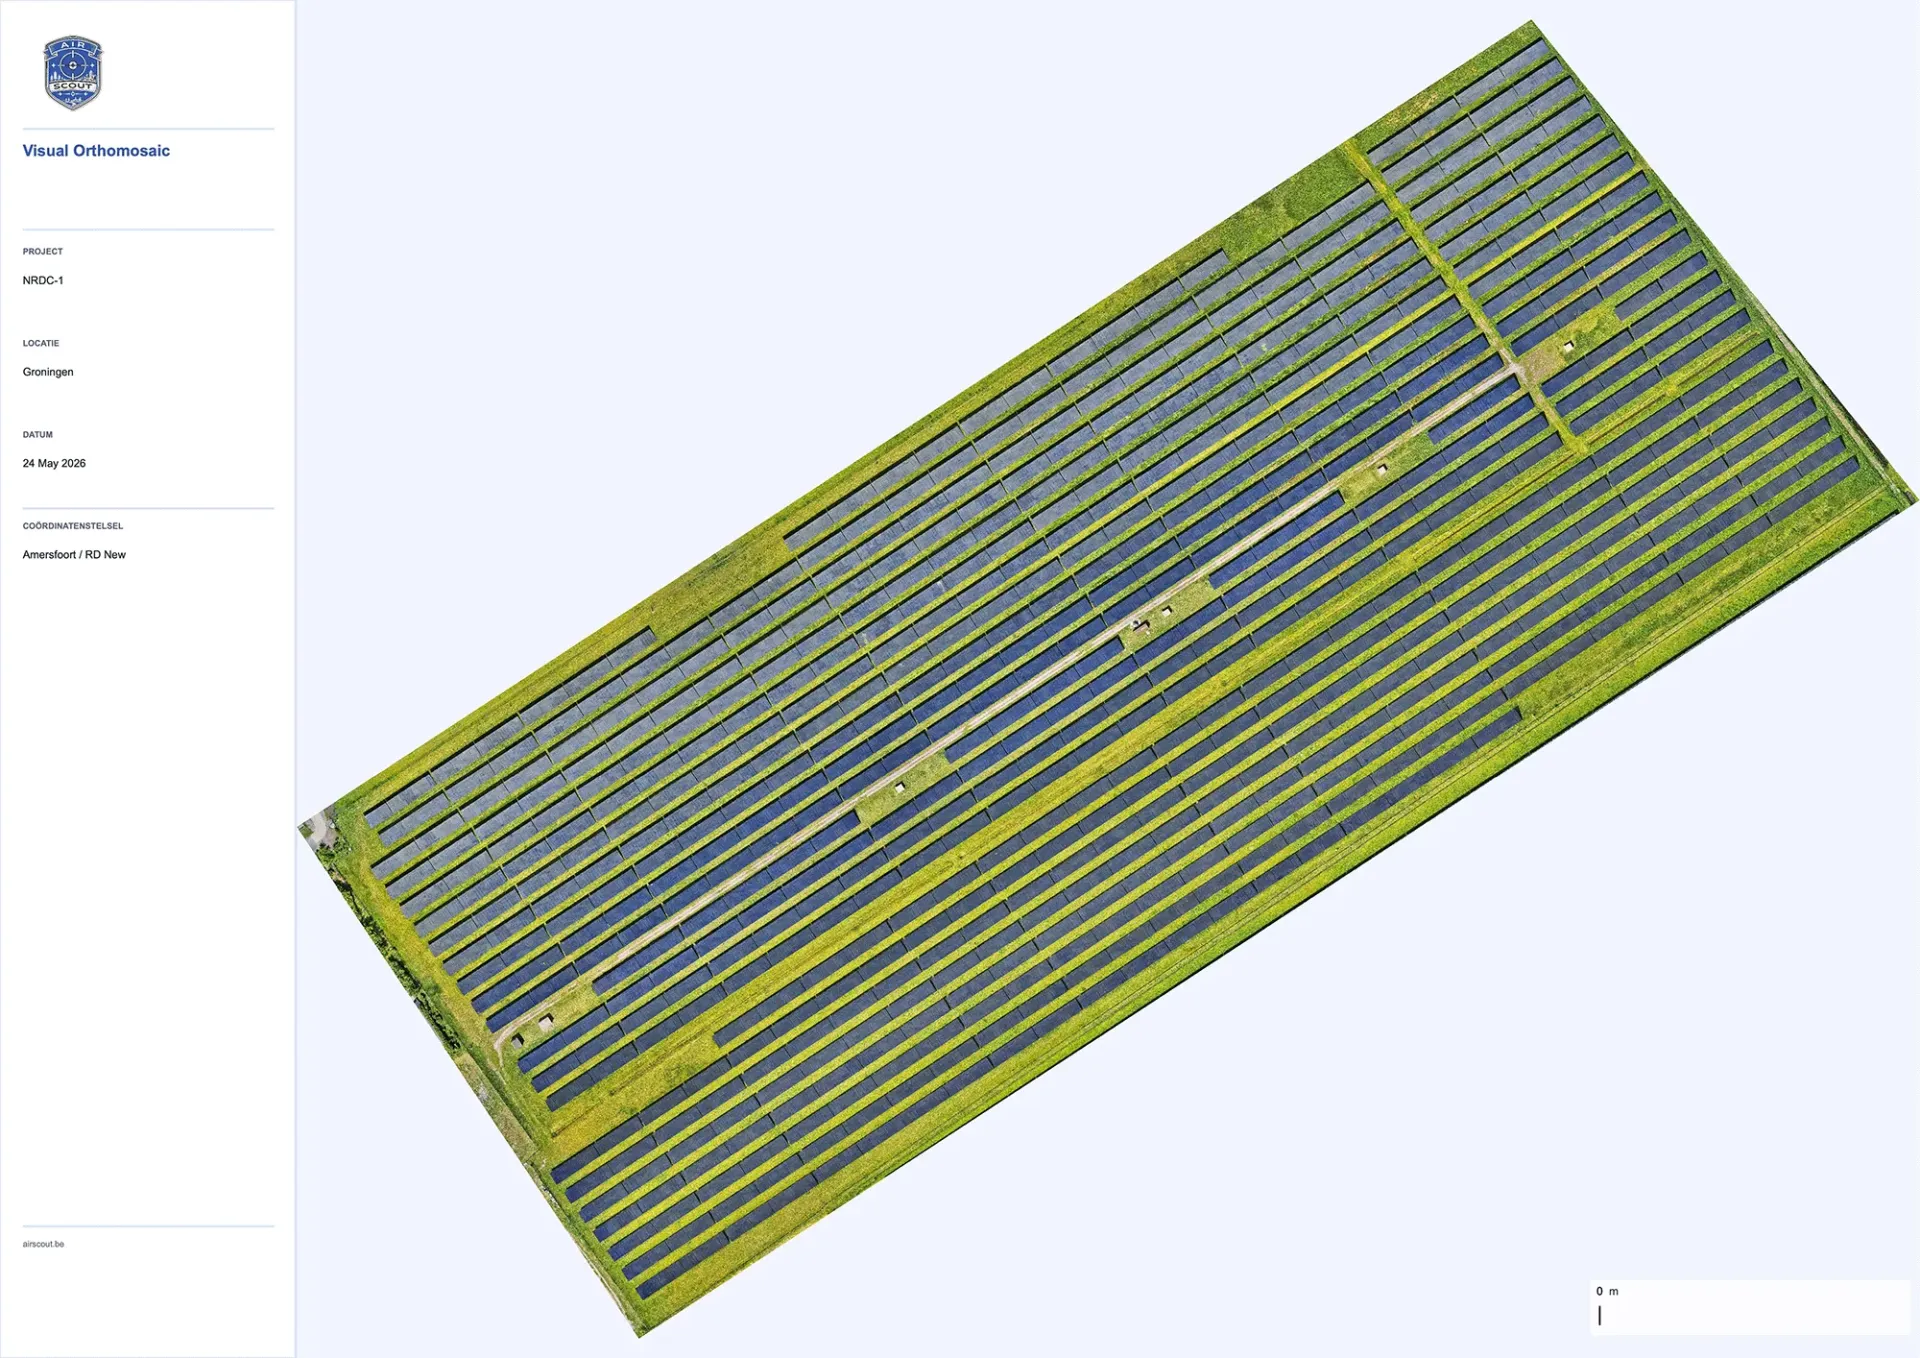
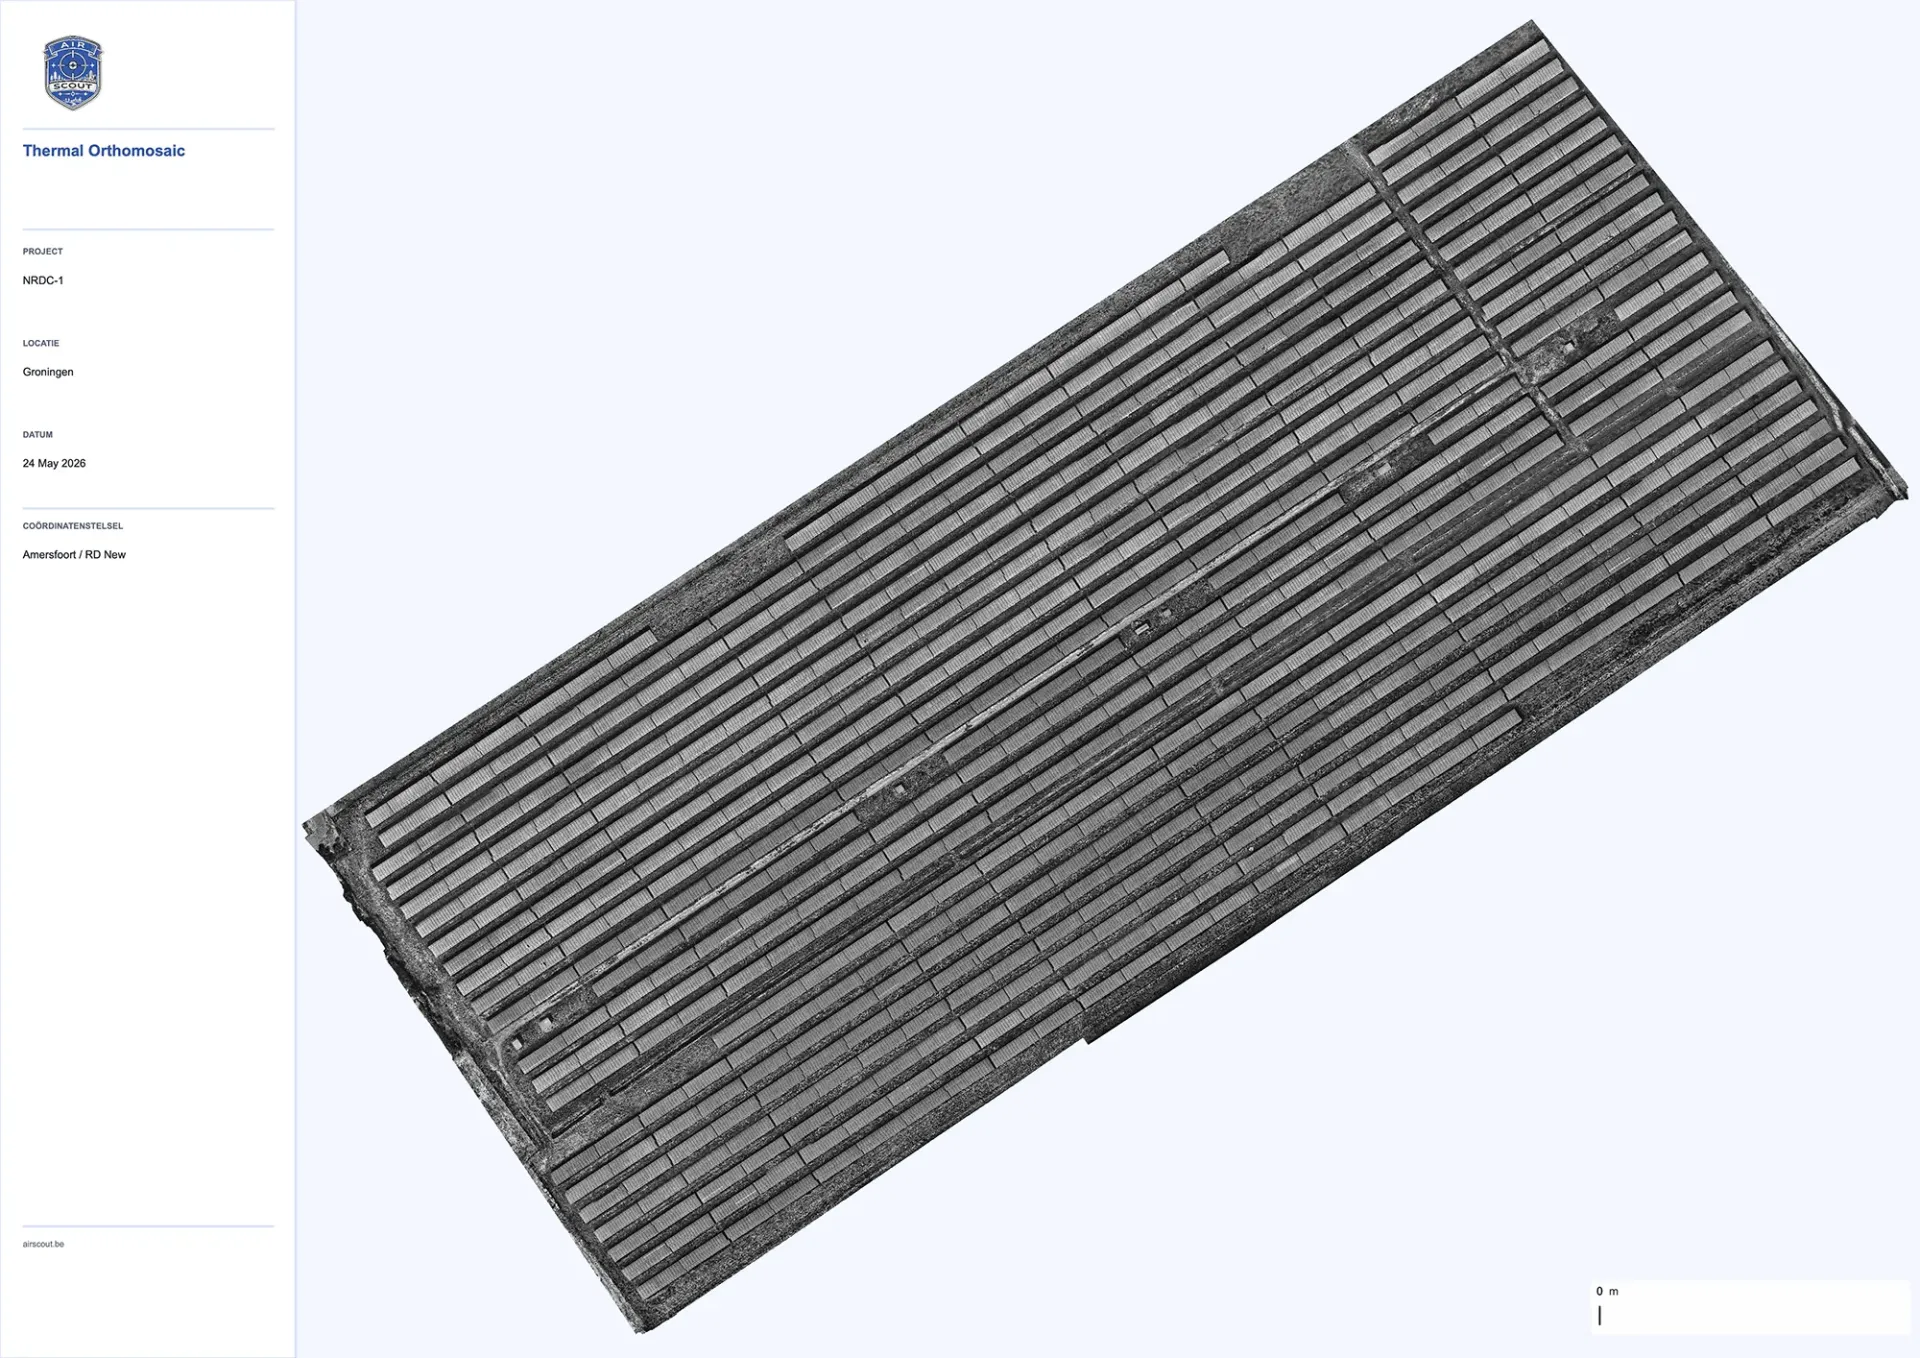
At the end of the day, two complete datasets are on the cards — each processed independently. The thermal images are converted into a georeferenced orthomap on which every anomaly is precisely localised: overheating cells, bypass diode issues, damaged strings, or vegetation. Alongside each thermal finding is the corresponding visual image — so you see not only that something is wrong, but exactly what.
RGB images, georeferenced and processed into a visual orthomosaic of the full site. Shows panel condition, structural context, and vegetation.
Radiometric IR images with real temperature data per pixel, processed into a thermal orthomosaic with precise localisation of every anomaly.
Delivery to the client
The approach varies per client and assignment. The quality standard does not.
Data delivered in the required formats, ready for direct import into the client's existing environment.
Report with map overview, per-panel findings, and priority list — directly usable without additional software.
After the flight, all images are processed into a georeferenced orthomosaic — both visual and thermal. These maps are scalable, precisely localised, and ready for direct import into GIS environments or the client's existing data platforms.
In the thermal orthomosaic, anomalies appear as lighter zones or white streaks. These patterns indicate panels radiating significantly more heat than their surroundings — a signal requiring further investigation. Whether it's a defective bypass diode, a damaged string, or vegetation: the location is precisely georeferenced and directly usable by the maintenance team.
Managing a solar park portfolio?
Curious what a professional thermographic inspection yields for your installations? Get in touch for a no-obligation conversation.
Get in touch